The Premise
There is a Fourth Statement that is common and useful across all businesses.
Finding it would be like finding a new treasure map. The new map would help you know where you are, know where you’re going, and know if you need to adjust — and help you prioritize which adjustments you can make.
The old map wasn’t designed for that. Traditional financial statements were invented in 1494. They were designed for compliance, not clarity.
The Fourth Statement is designed for clarity.
The Five Characteristics
The Fourth Statement:
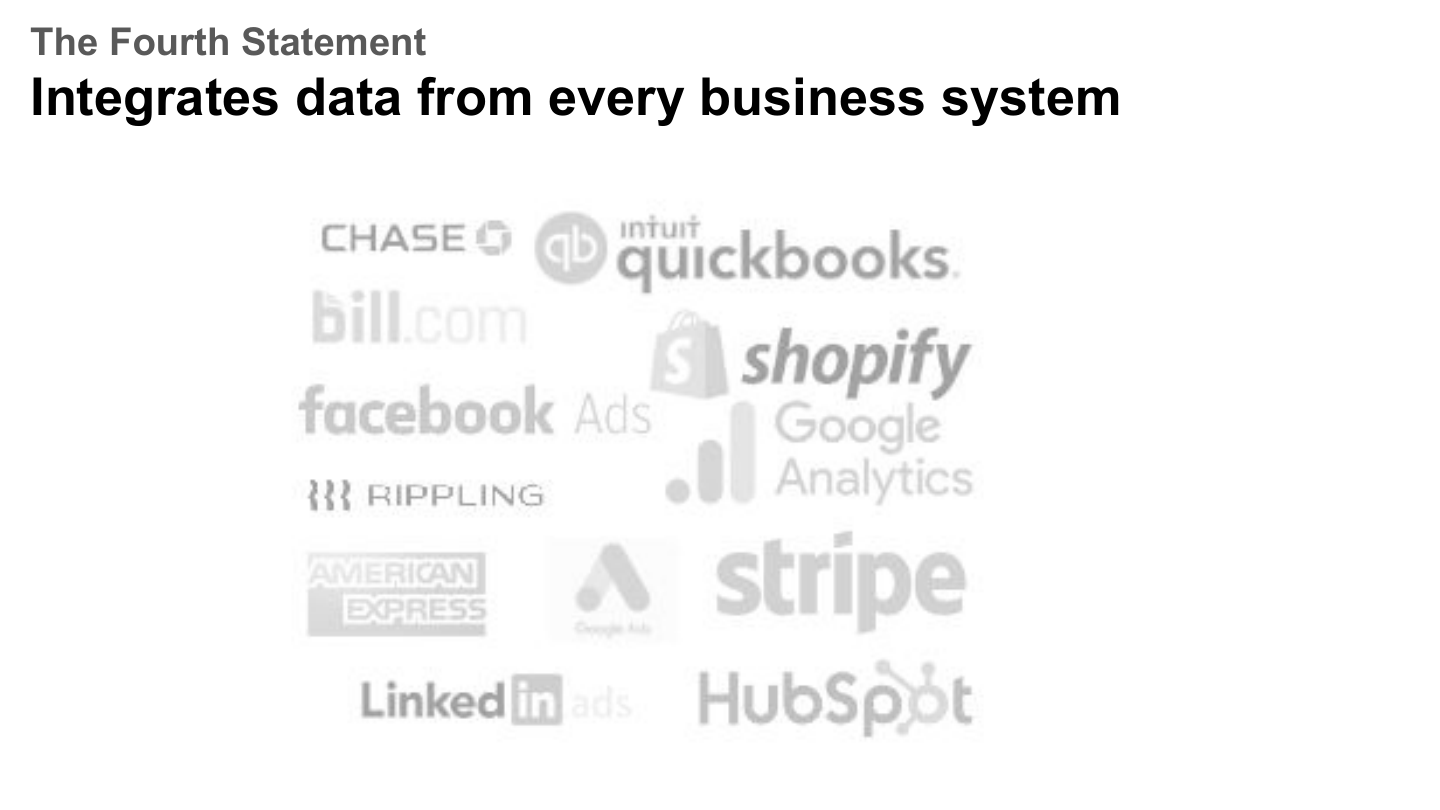
1. Integrates data from every business system — QuickBooks, Shopify, the ad platforms, the CRM, the bank, all of it.
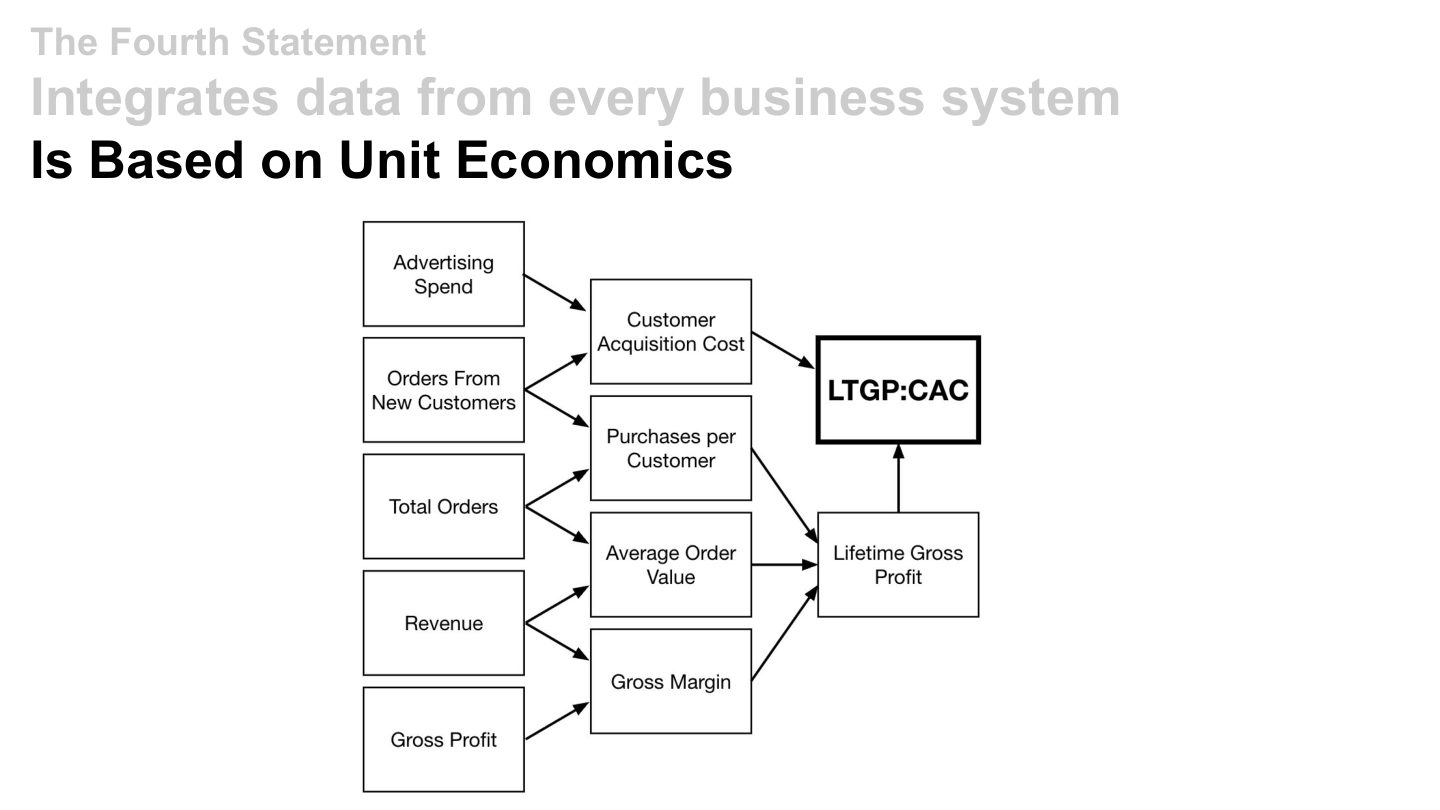
2. Is based on Unit Economics — the business seen at the per-customer level: ad spend and new customers become CAC; purchases, order value, and margin become Lifetime Gross Profit; together they make the headline ratio, LTGP:CAC.
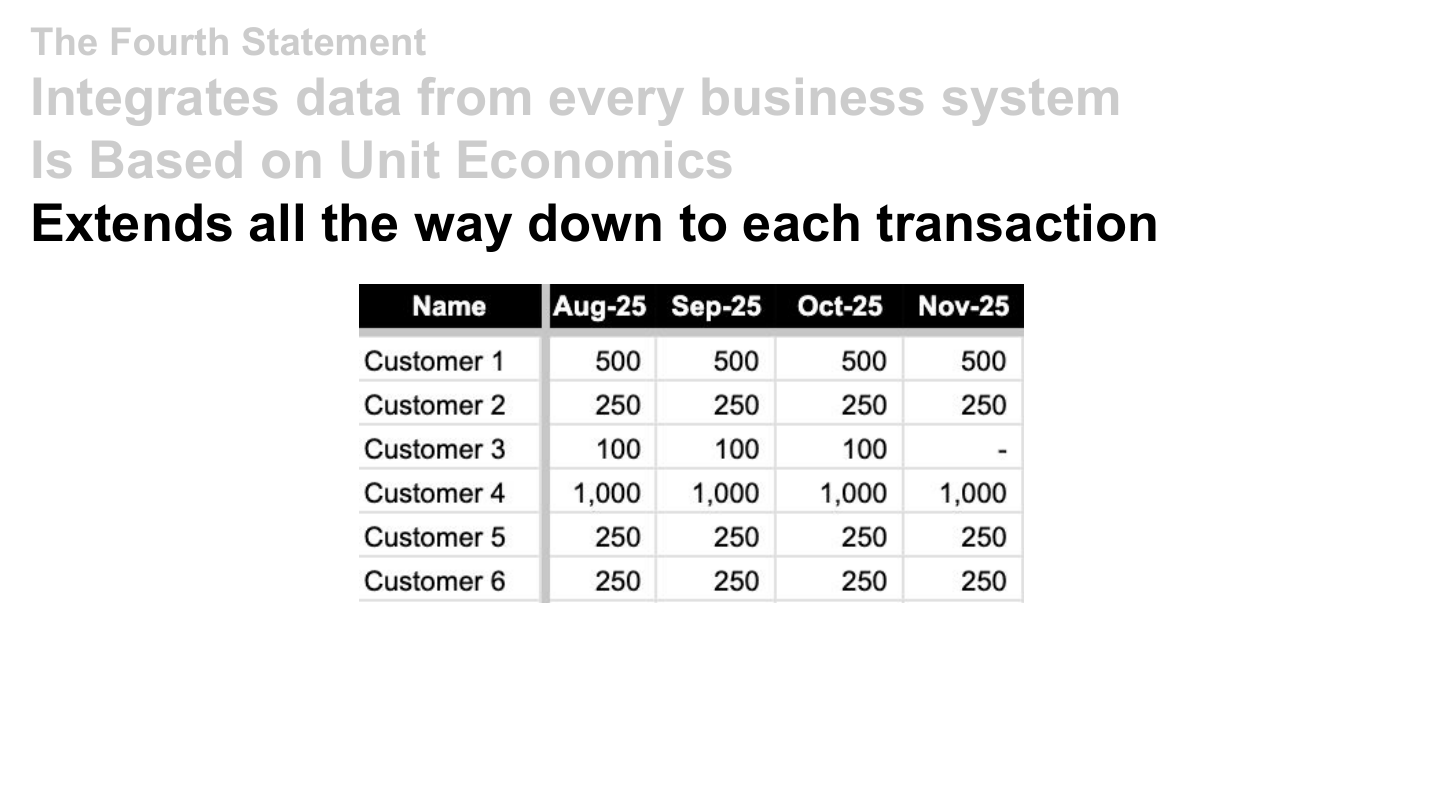
3. Extends all the way down to each transaction — every number decomposes to the customers and transactions underneath it.
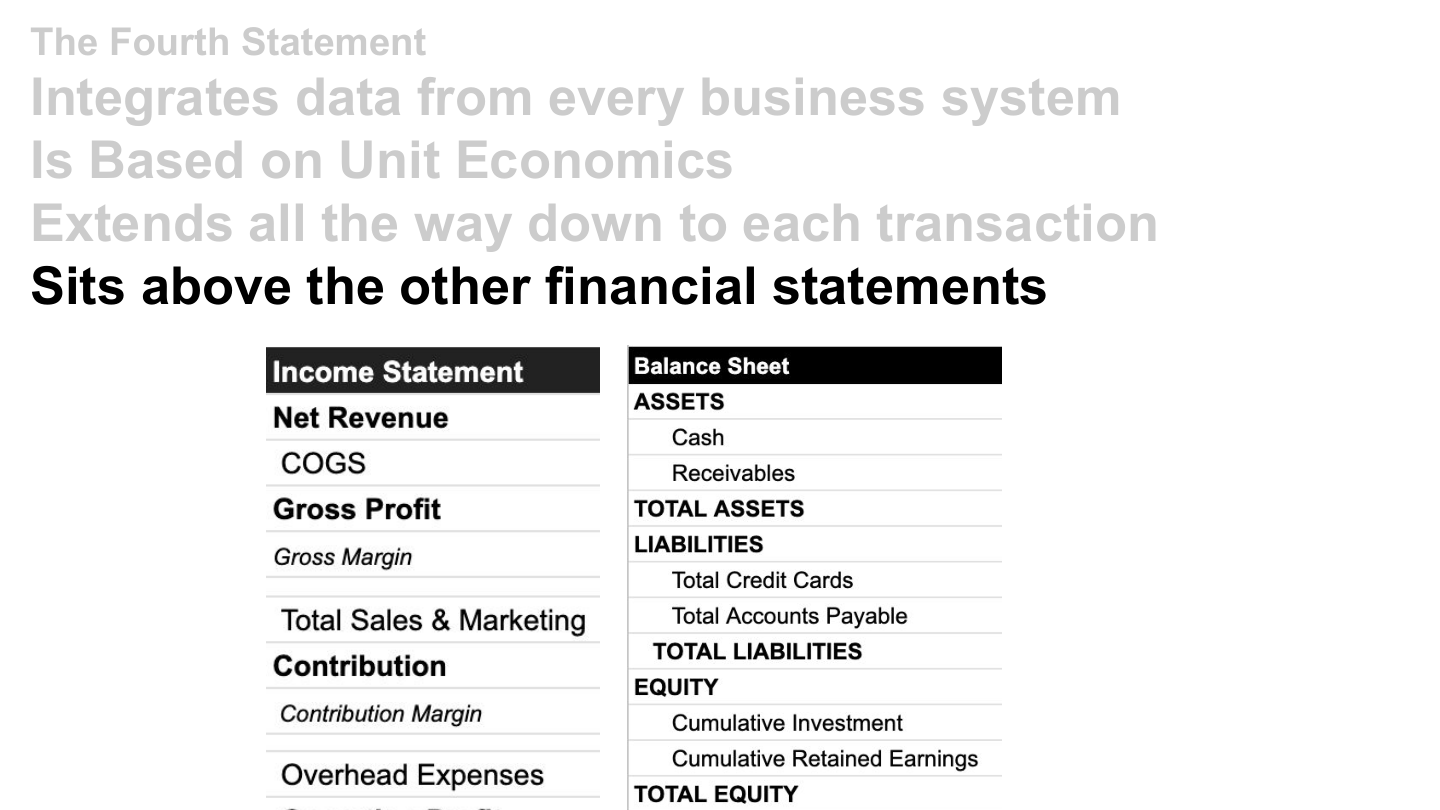
4. Sits above the other financial statements — the income statement and balance sheet don’t disappear; they move below it.
5. Ties everything together each week — not month-end. Weekly.
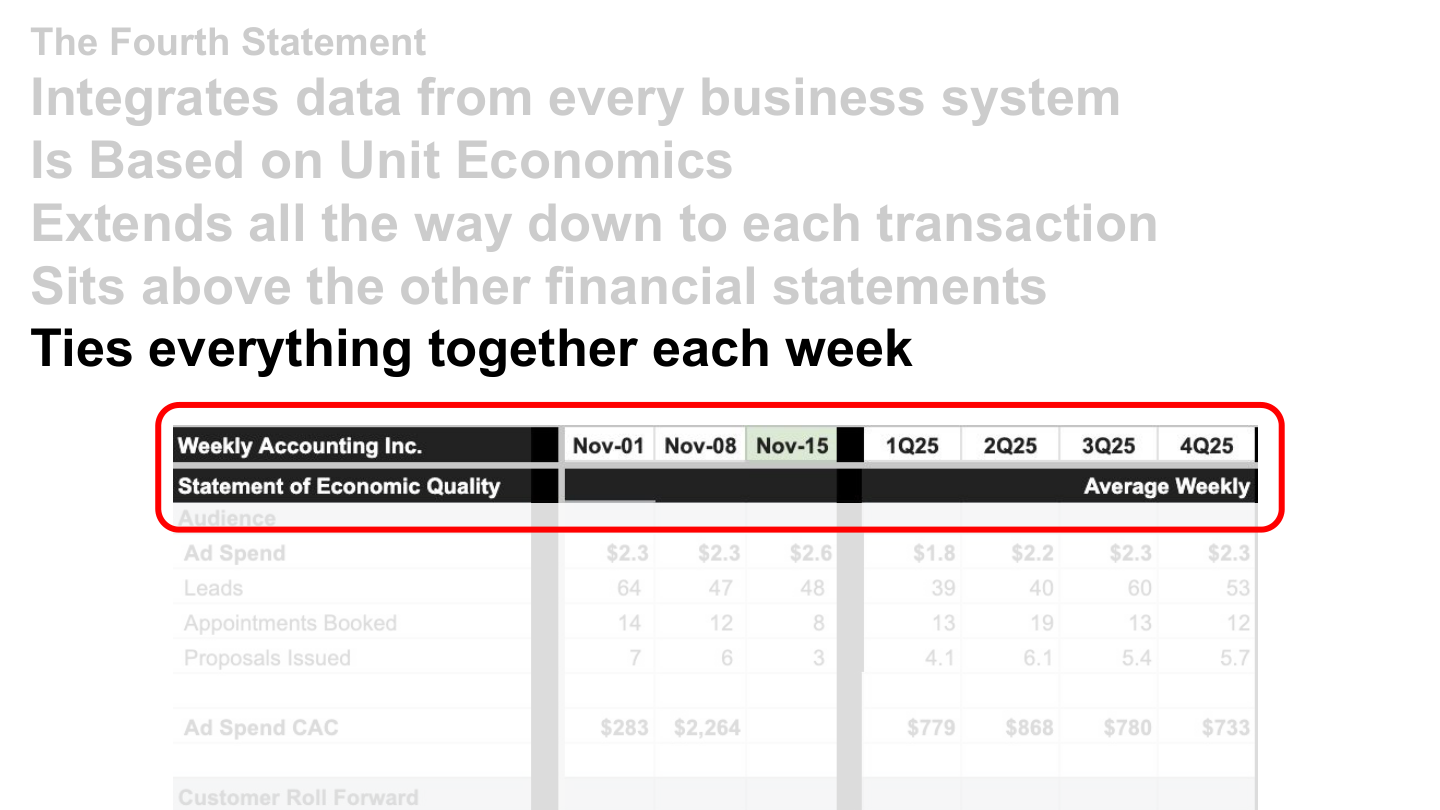
We call it the Statement of Economic Quality.
The Shape of It
Every business has an audience that it tries to convert into payments from new customers — and keep them coming back. The Statement of Economic Quality follows that arc.
Columns are periods — weekly, monthly, quarterly, annual. Same rows at every zoom level.
Rows are the key drivers — from the widest part of the funnel, through sales, to fulfillment. Then the per-customer language: Customer Acquisition Cost, Average Revenue Per Customer, Lifetime Gross Profit, Lifetime Contribution, Contribution Margin. The rows shown are never the only rows — there are always other rows with other levels of detail.
The traditional statements sit below — income statement, then balance sheet.
A matrix of numbers is complex at first. Just read and understand each row.
The Weekly Rhythm
Here’s the thing your accountant doesn’t want you to know: for running your business, you can ignore month end.
52 feedback loops per year are better than 12.
The weekly view — Monday Morning Metrics — shows the past few weeks, the average weekly results for the last four quarters, and progress against the quarter’s target. It’s very difficult to argue with that kind of truth, consistently presented and reviewed weekly.
The feedback loop runs both directions: unit economics and financial statements looking back; assumptions and forecast looking forward. Forecasting gets easy at quarterly: “This quarter we’ll spend about the same on marketing, drive a similar number of leads, and close a few more customers than last quarter.”
And errors get caught sooner because they’re easier to spot — a $11k-per-week ad line that doesn’t look right gets flagged Monday, not at month-end close. You’ll find more errors the first few weeks than after you’ve looked at the same rows for a while. When you first start looking at something, it’s messy. Keep looking. Feedback loops make systems stable.
Right Data, Empowered Team
When you put the right data in front of an empowered team, they get better.
The qualities of right data: Timely (daily view, weekly oversight, quarterly goals) · Accurate (transaction-level detail with a feedback loop) · Simple (these rows, these goals) · Comparable (these trends) · Actionable · Relevant · Connected · Honest.
The Journey
Aligning a team around a custom Fourth Statement is a journey: Troubled → Functional → Integrated → World Class. Data quality moves from “traditional monthly close done by an accountant” to “the unit of work is self-aware.” The feeling moves from “we won’t know revenue until the books are closed” through “where’d you get that data? that’s not right!” to “we know where to focus our attention.”
That middle phase — the arguing phase — is normal. It’s the team aligning its understanding of what the numbers mean.
The Ending
Once you see business this way, the old ways of seeing will seem quaint.
Related: The Fourth Statement · The SEQ · The IFM · Twelve Actions · The Premise