Running a business feels like driving a bus with a dirty windshield.

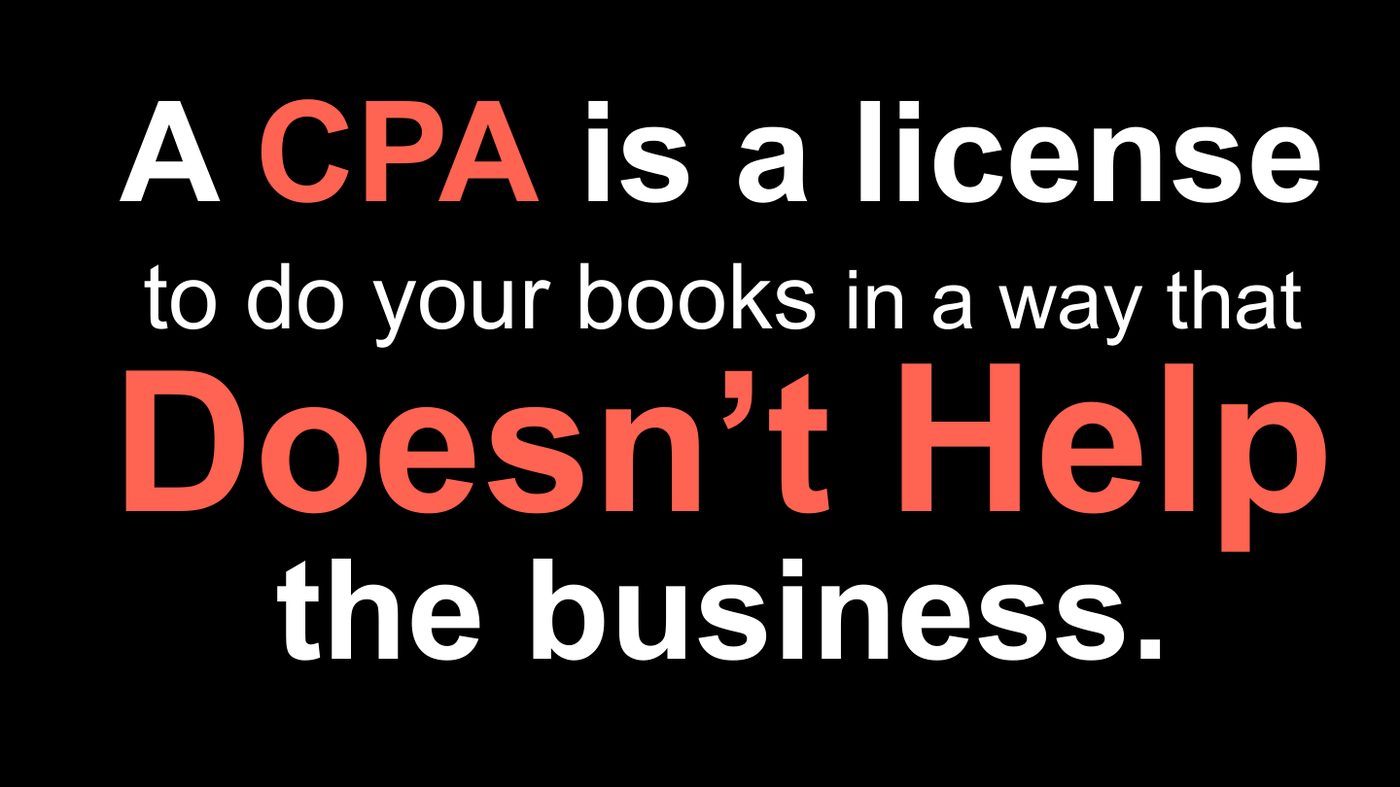
For some reason, the accountants are busy cleaning the back windshield.

So people look at data from every business application separately. Trying to see through that is like trying to see through The Matrix. They end up making decisions with bad or incomplete information. They can’t figure out why they’re not growing while their cash balance is dwindling. It often feels like they’re spraying cash out the muffler to make the car go faster.
The Challenges Grow with the Business
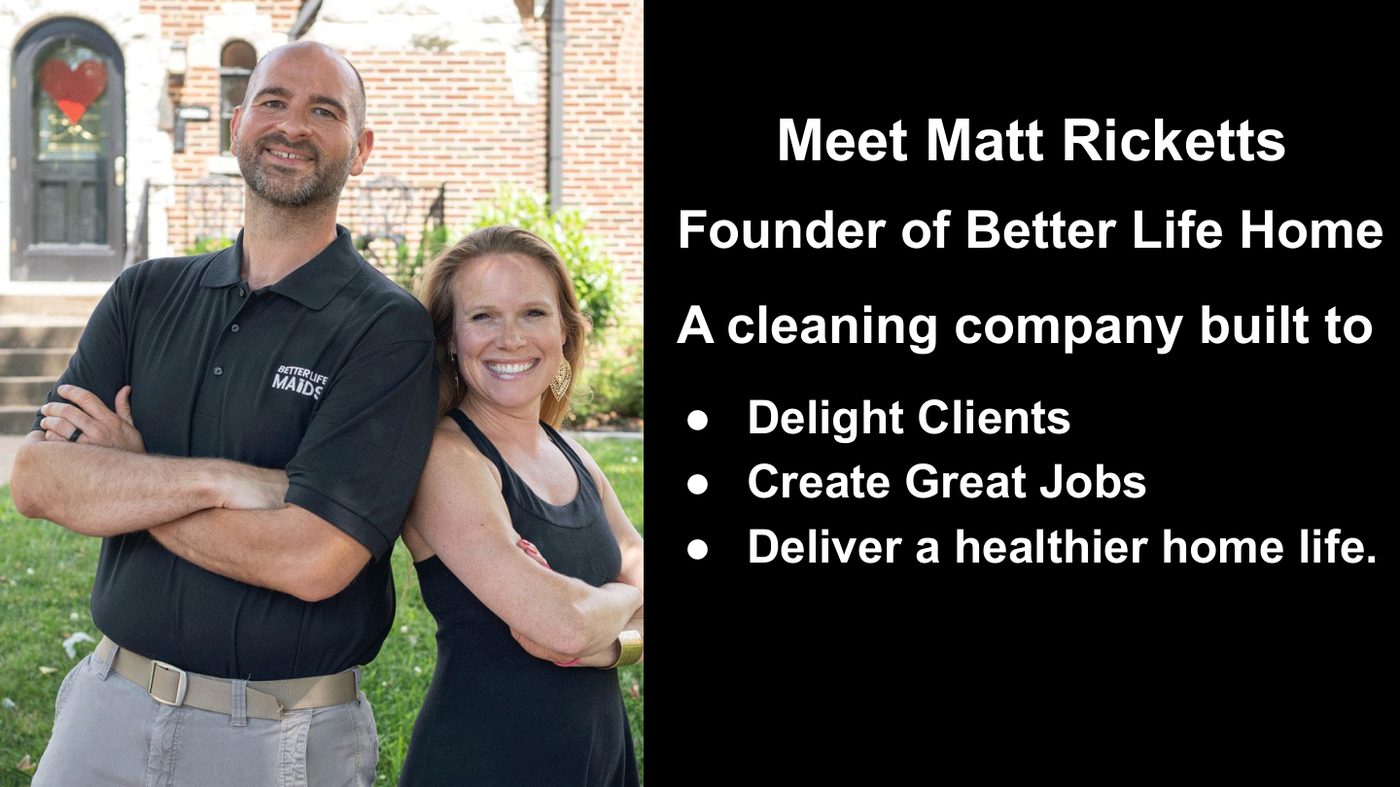
Meet Matt Ricketts, founder of Better Life Homes — a residential cleaning company. As the business grew, the financial information Matt had in QuickBooks stopped making sense. The windshield was dirty. His accountants weren’t helping him — they were cleaning the back windshield. He didn’t know how much to spend on marketing, and he’d set goals but never hit them.
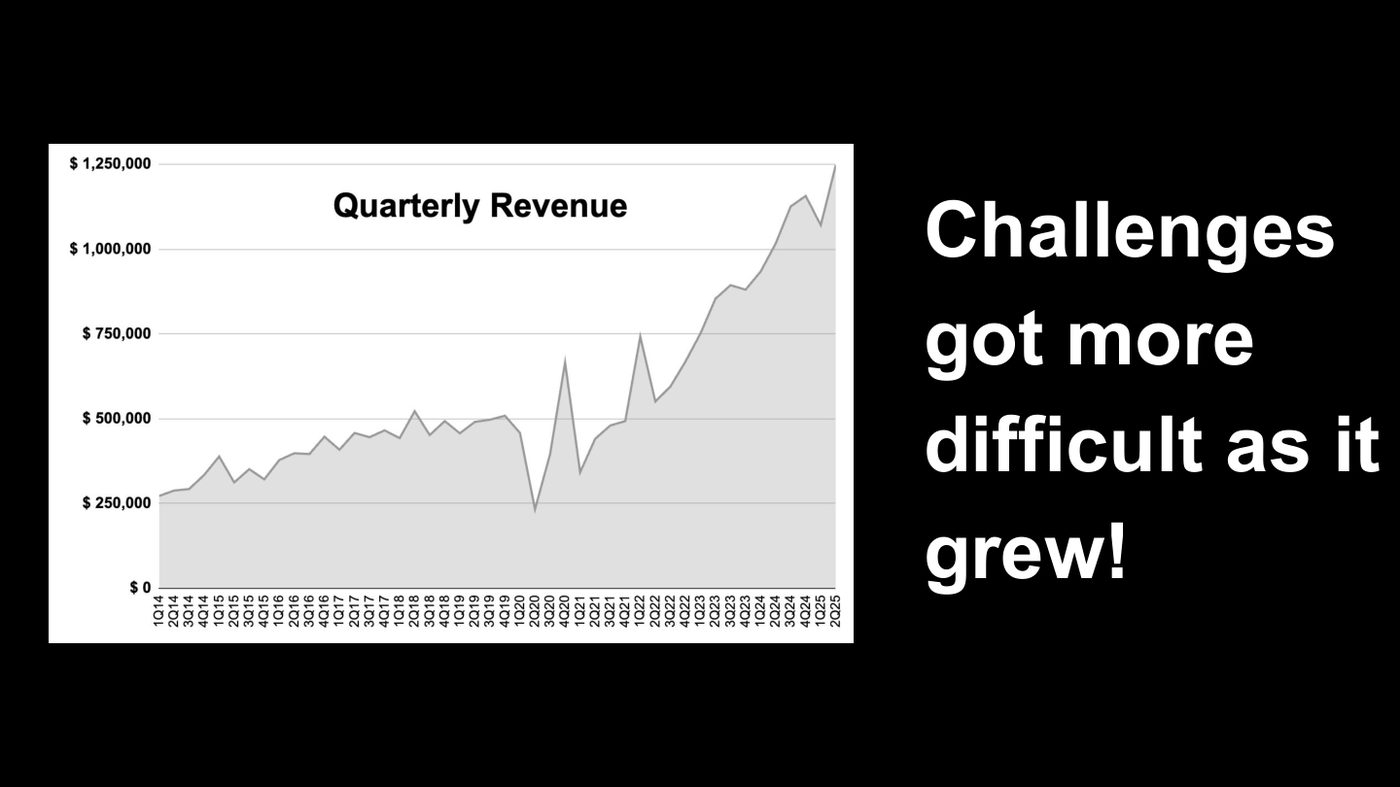
His accountant couldn’t help because the map they used was old. Matt went looking for a better way.

There Is a Better Way
We invented this system over nearly 30 years — while building five $100 million companies and a $100 million fund. With this system we’ve helped founders turn their equity into cash: 18 exits, with a 19th in the works.
The system helps you forecast better, grow more efficiently, set sharper goals for your team, and manage your business weekly.
Always Bring Data to the Conversation
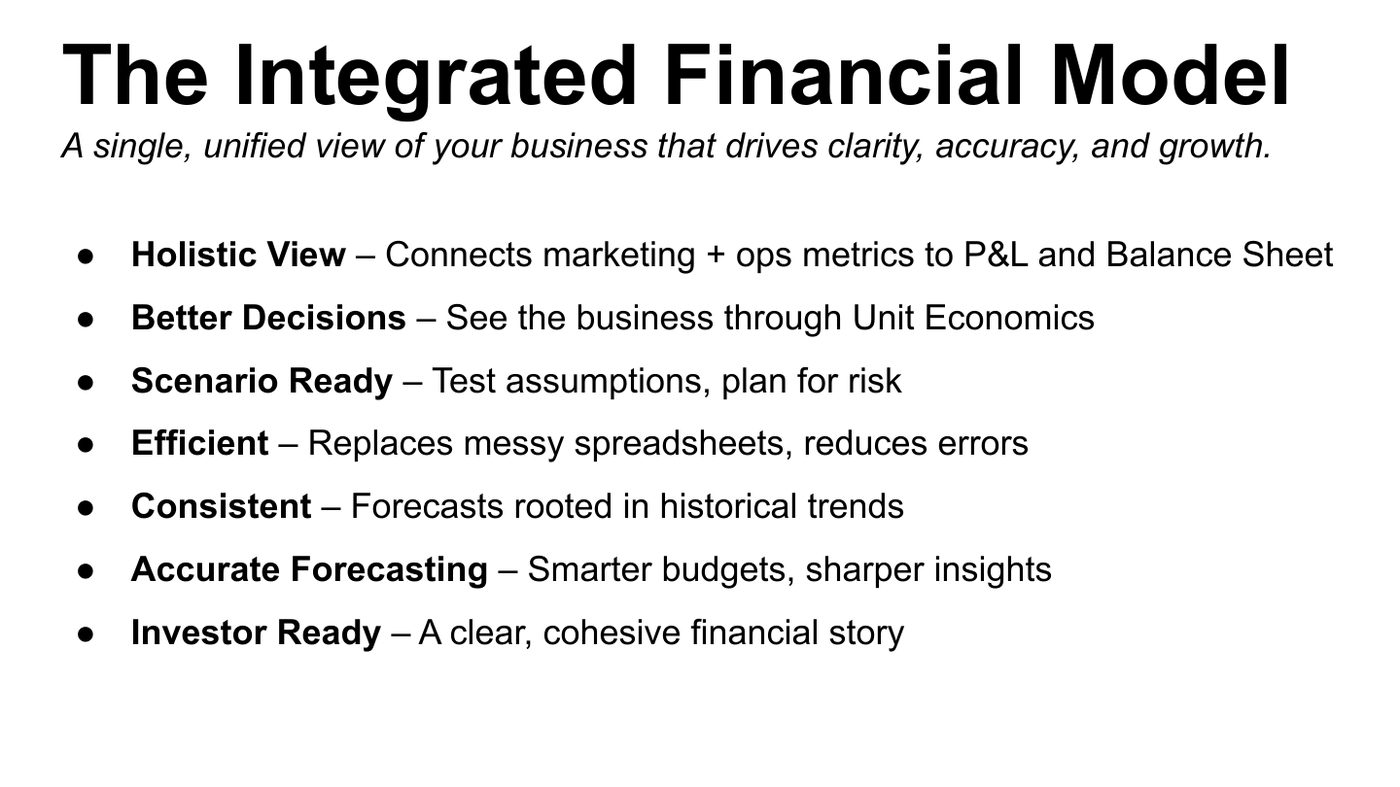
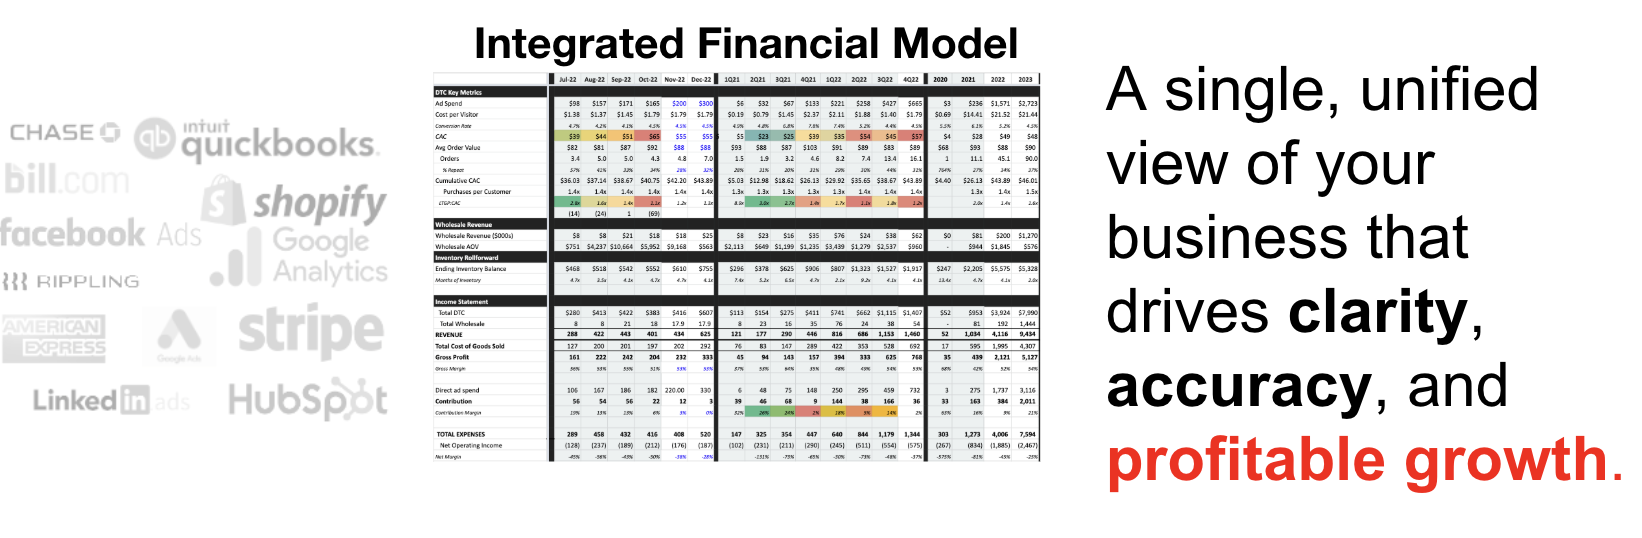
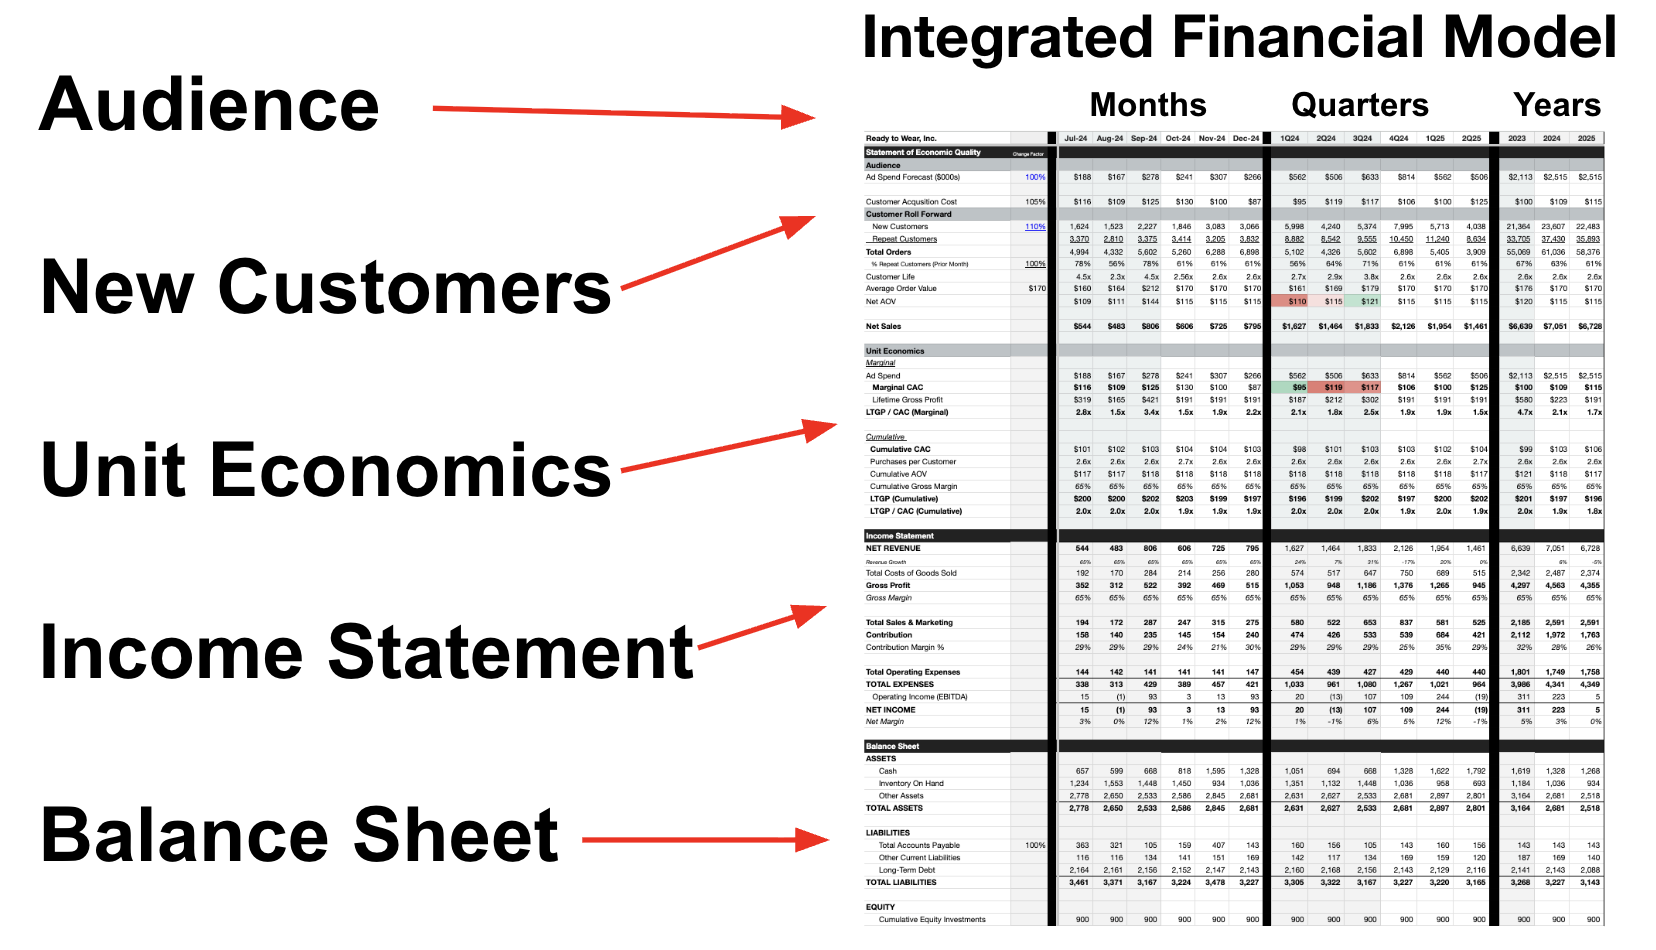
After getting access to Matt’s QuickBooks, Google Analytics, and other business applications, we built what we call an Integrated Financial Model (IFM) — a unified view of your business that drives clarity, accuracy, and profitable growth. It uses the same metrics to run the business as it does to forecast the business.
It’s Built on a Simple Truth
Every business has an audience. It tries to convert that audience into paying customers. It tries to keep those customers coming back.
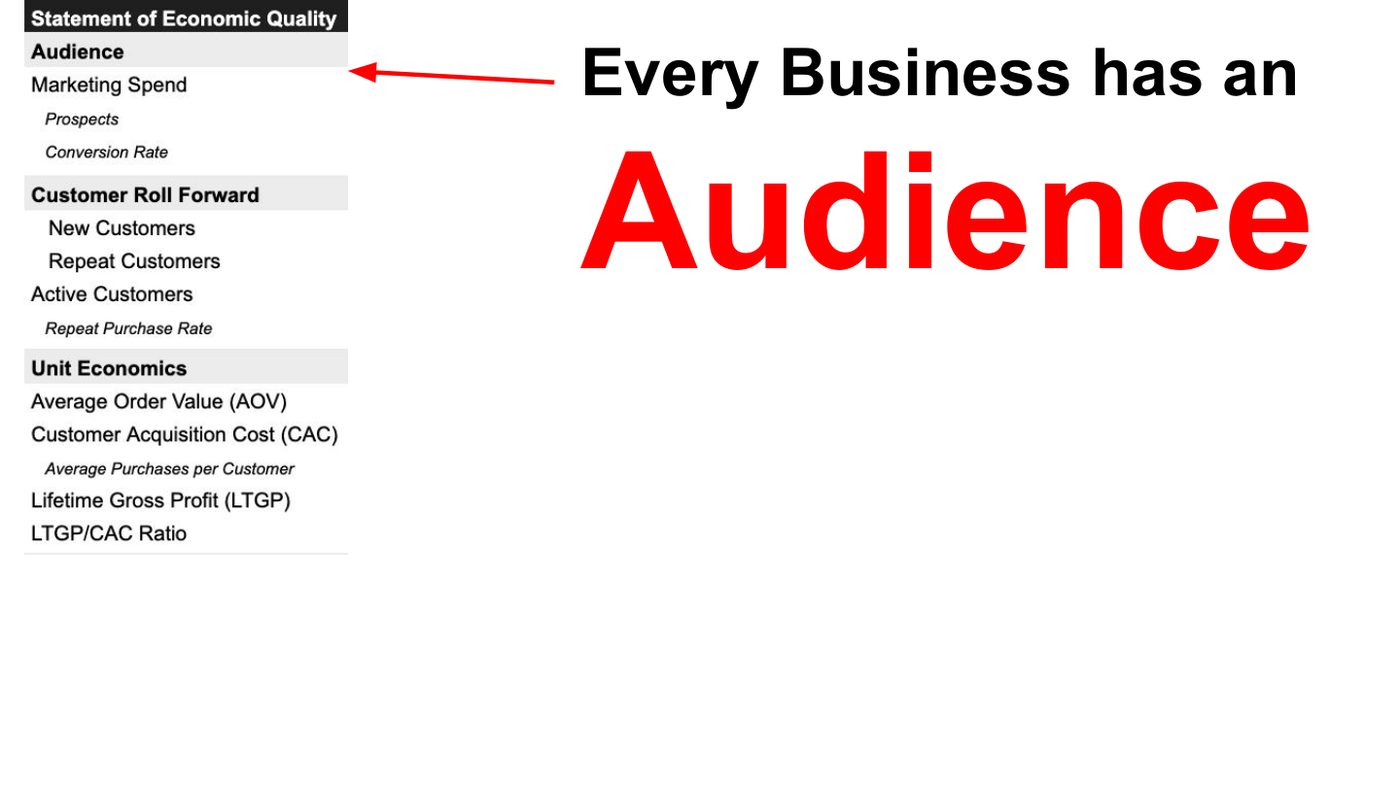
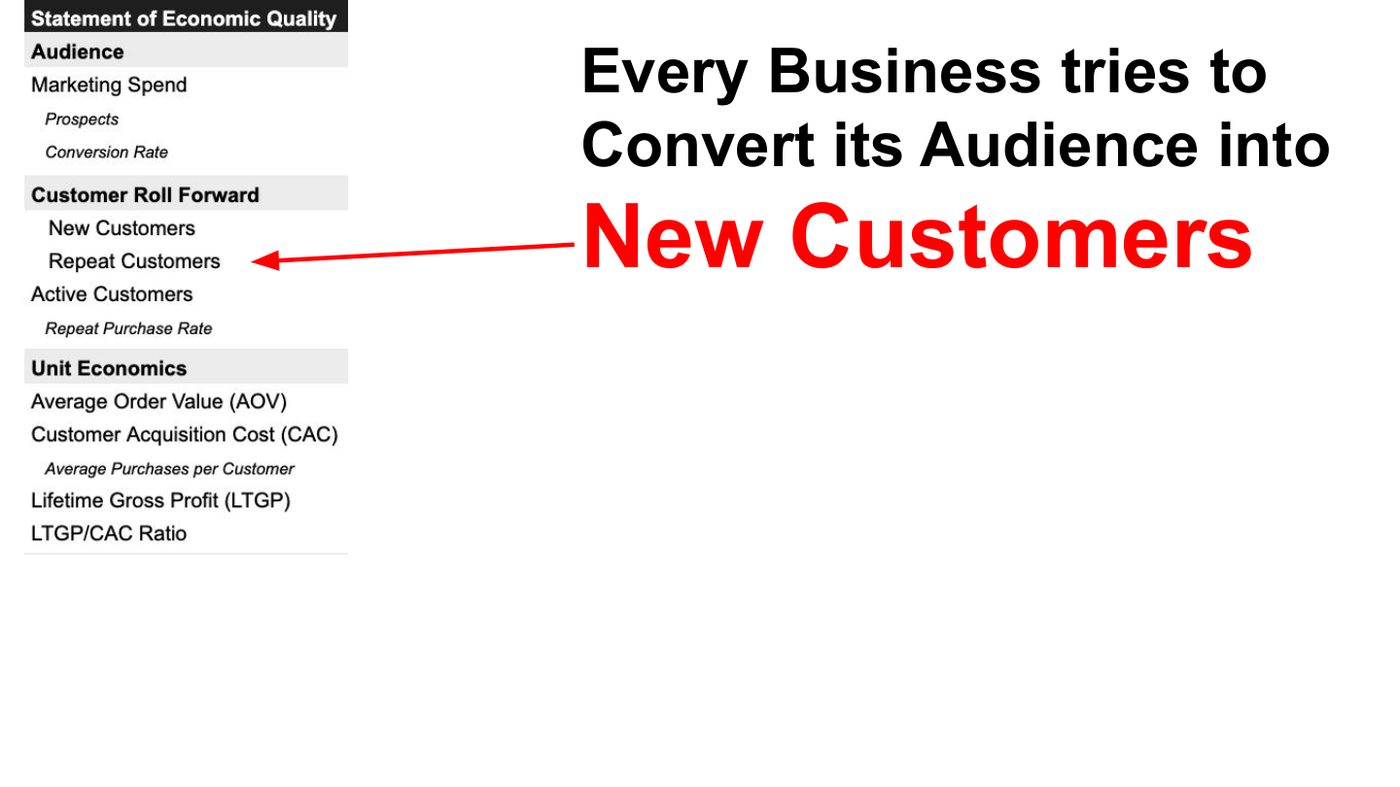
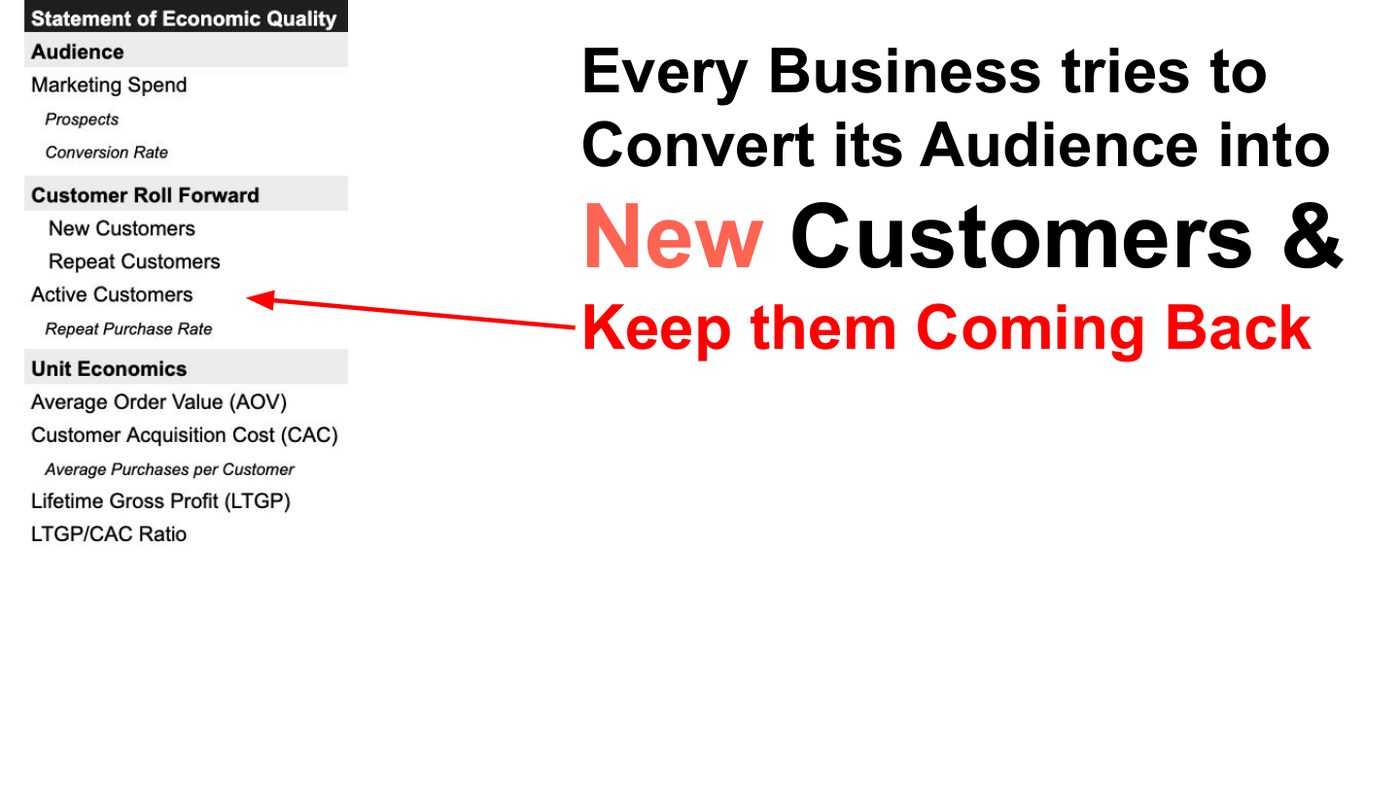
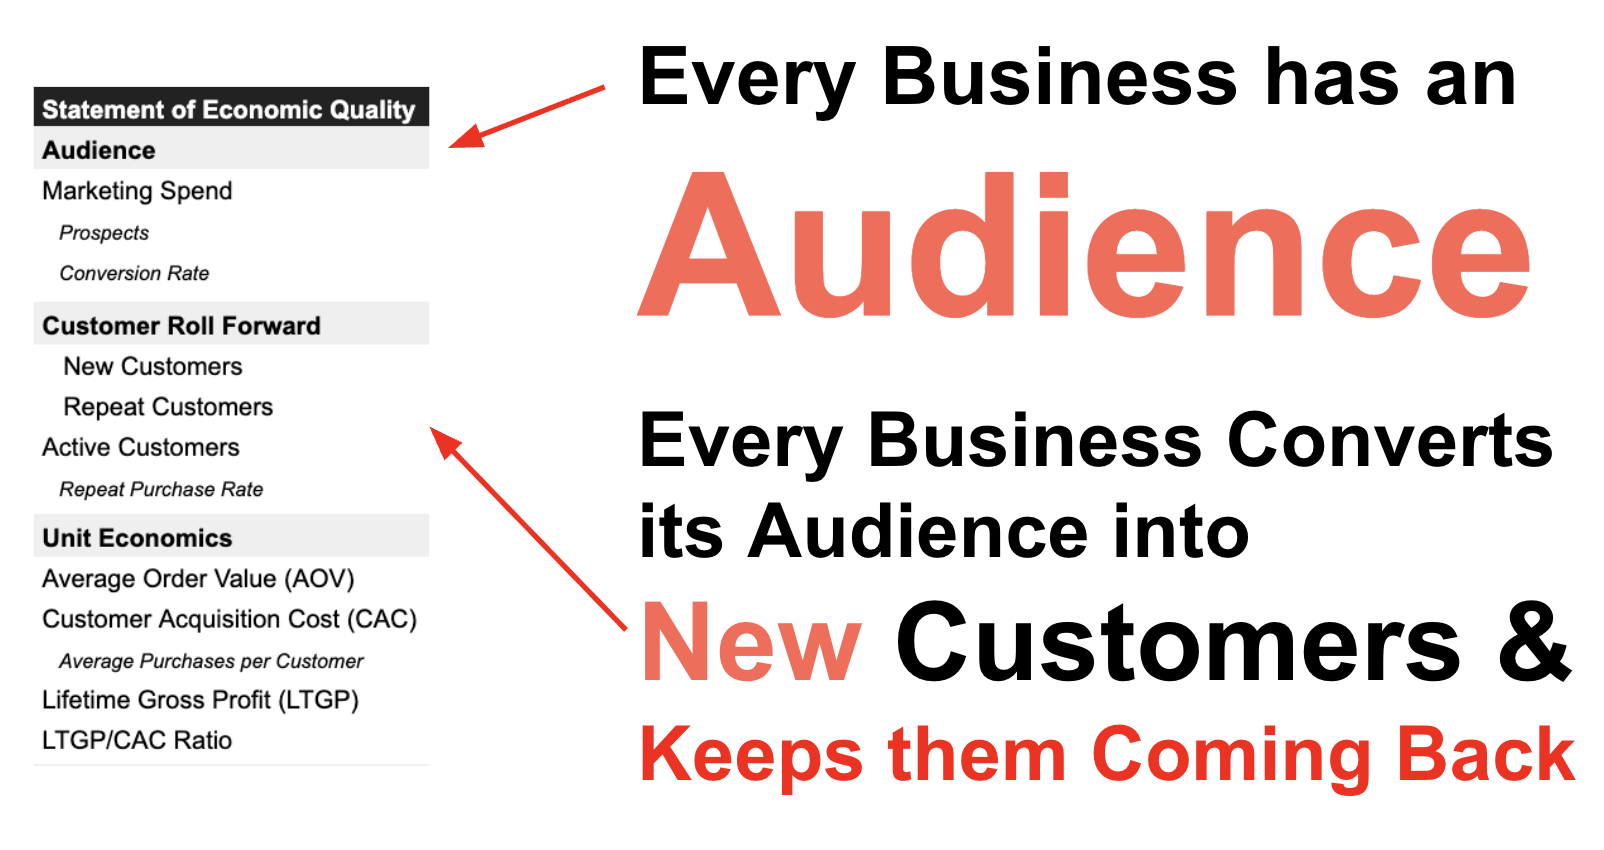
From that, we calculate unit economics — both for each period and cumulatively.
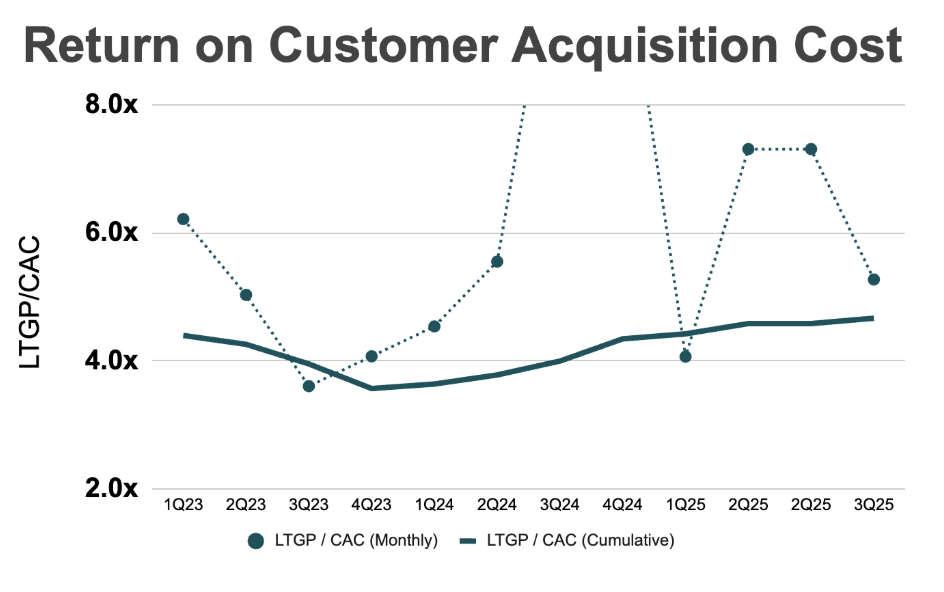
Don’t worry if you don’t exactly understand these charts yet. The pages of this garden will make them clear.
One Integrated View
We put these metrics above the income statement and balance sheet. We look at them weekly, monthly, quarterly, annually. We forecast revenue growth and cash. We set goals and track performance.
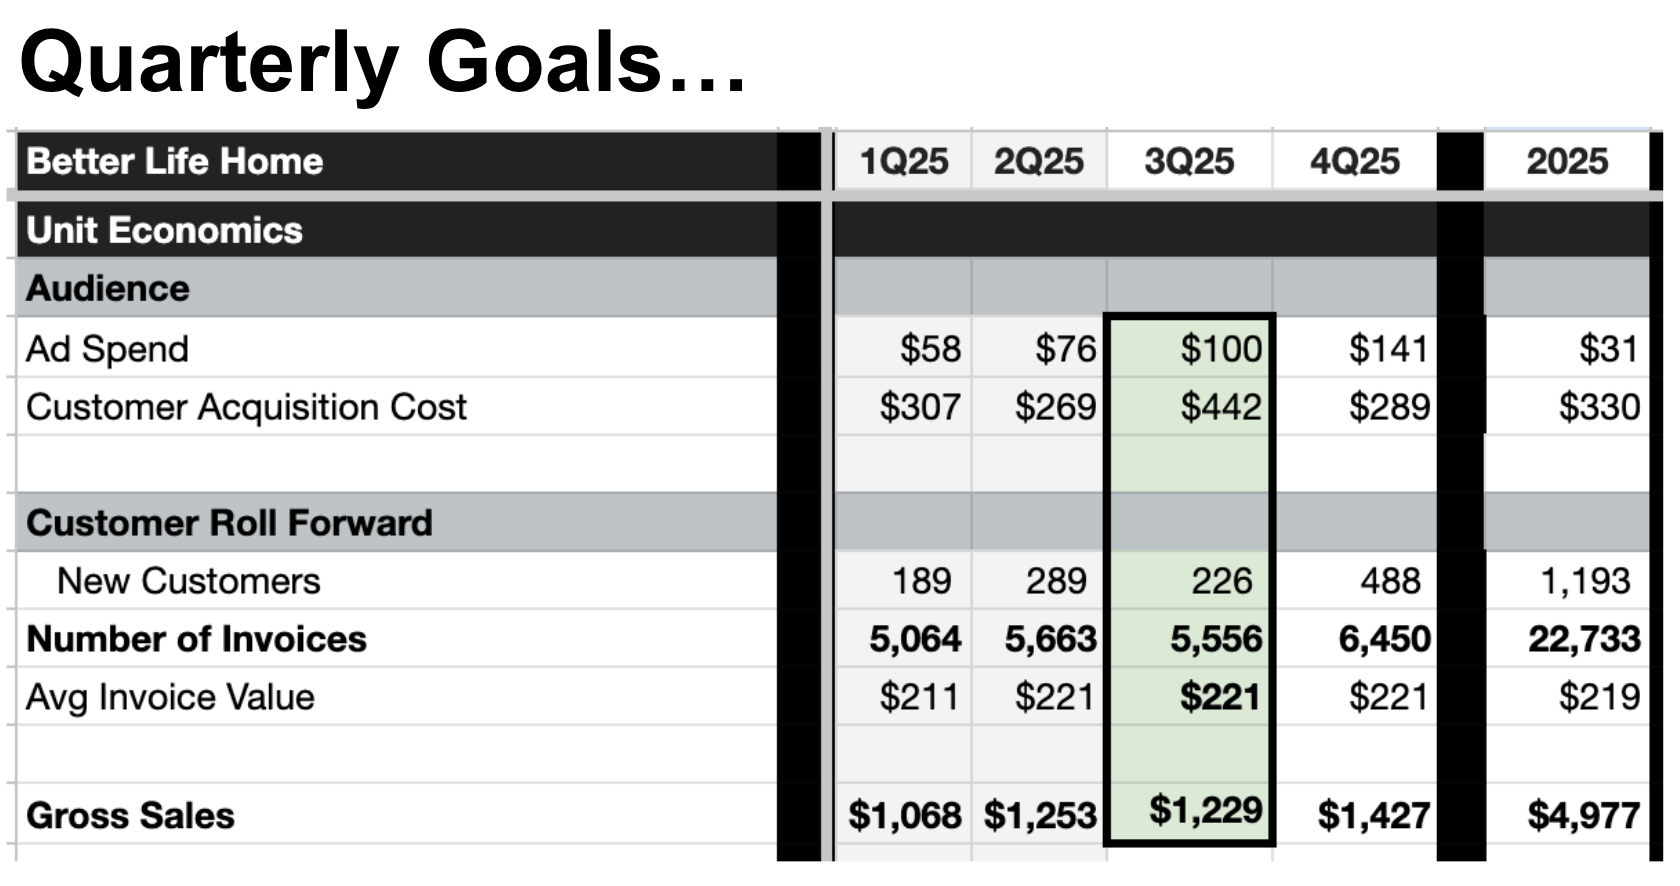
Here’s what Matt’s quarterly goals looked like for 2025:
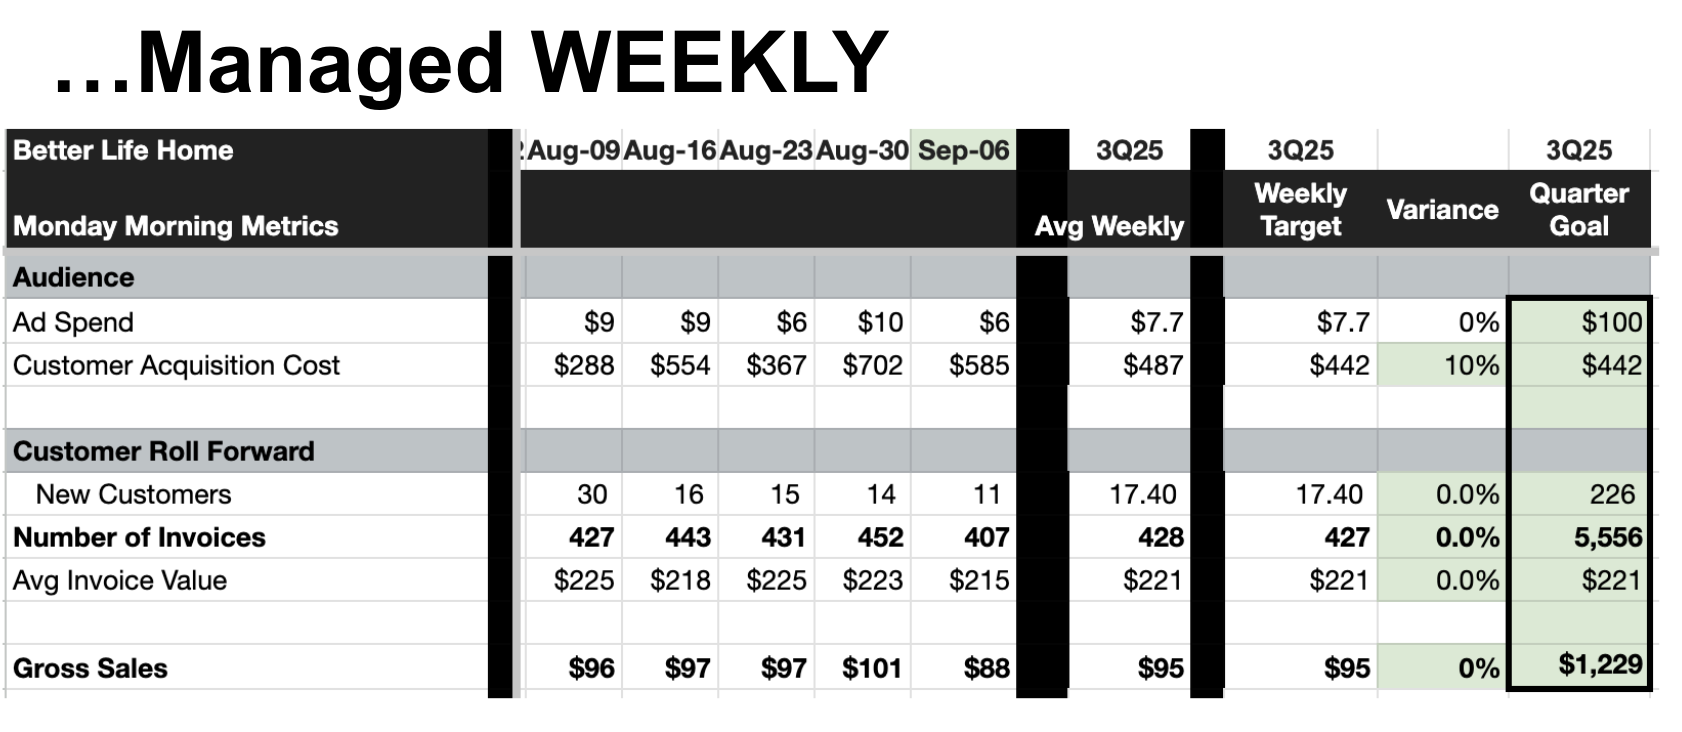
And here’s what his Q3 goal looked like eight weeks into the quarter — managed weekly:
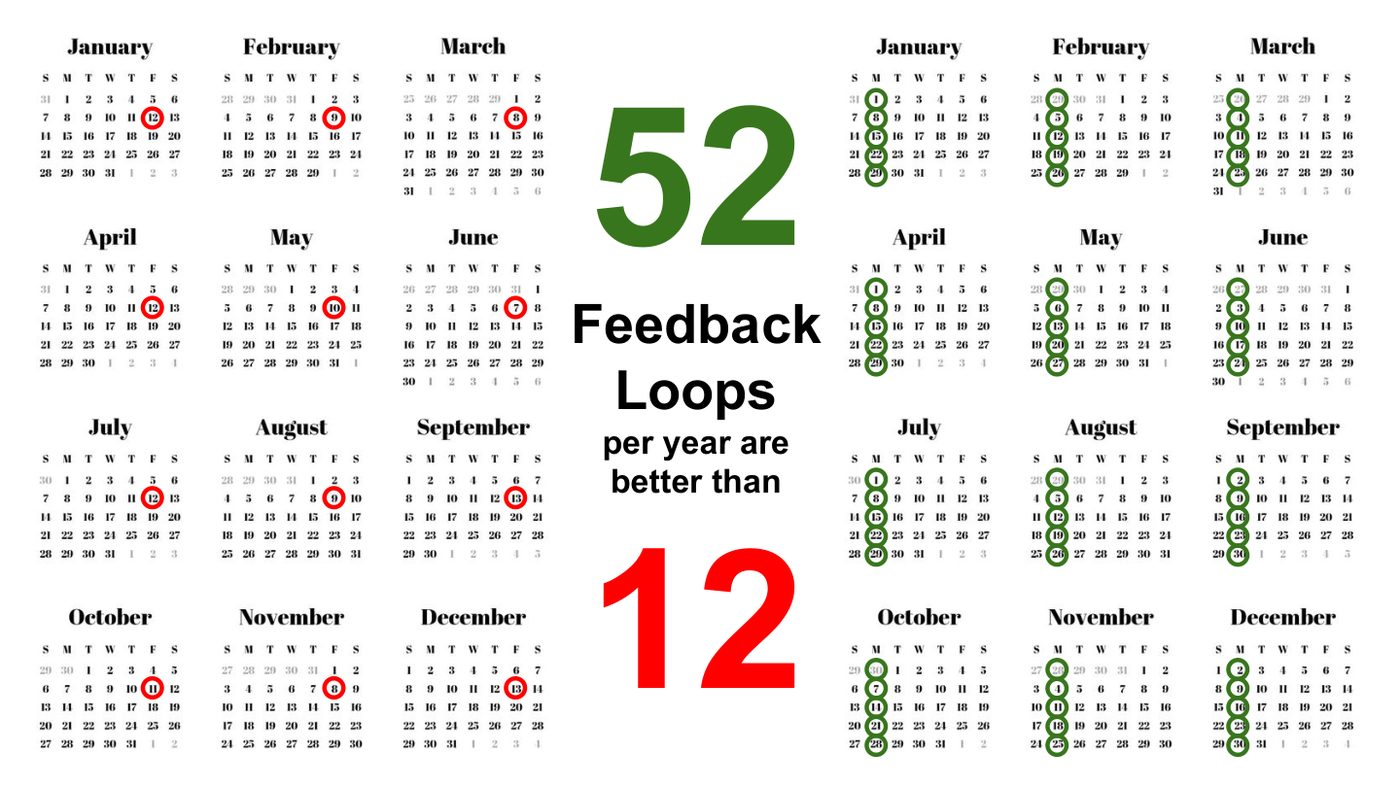
52 Feedback Loops, Not 12
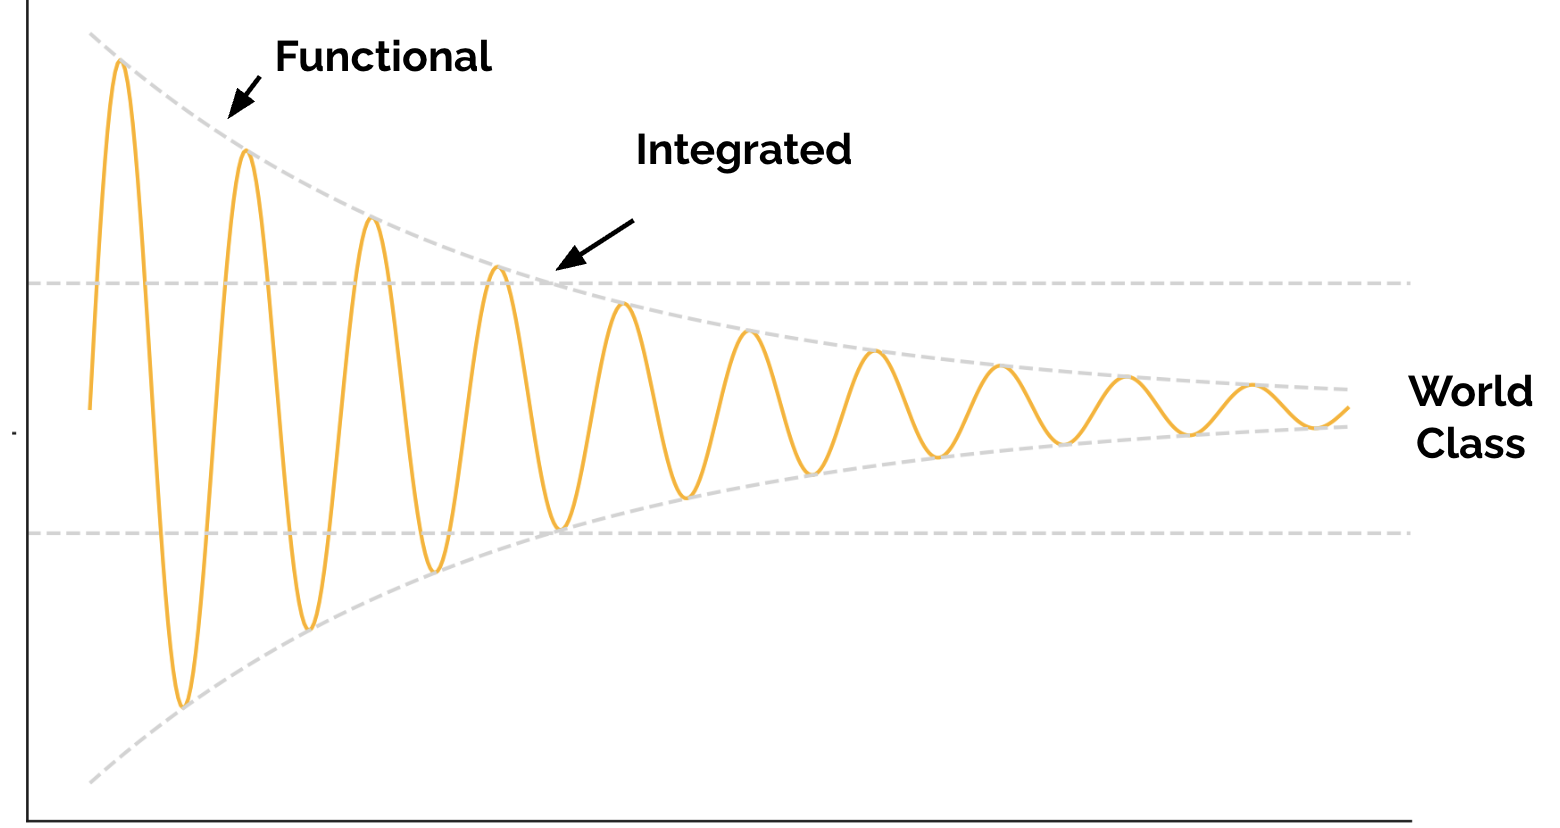
Feedback loops make systems stable. Fifty-two feedback loops a year are better than twelve. The first forecasts we made for Matt were functional. After several weeks, they became integrated. Eventually, the organization begins to run itself.
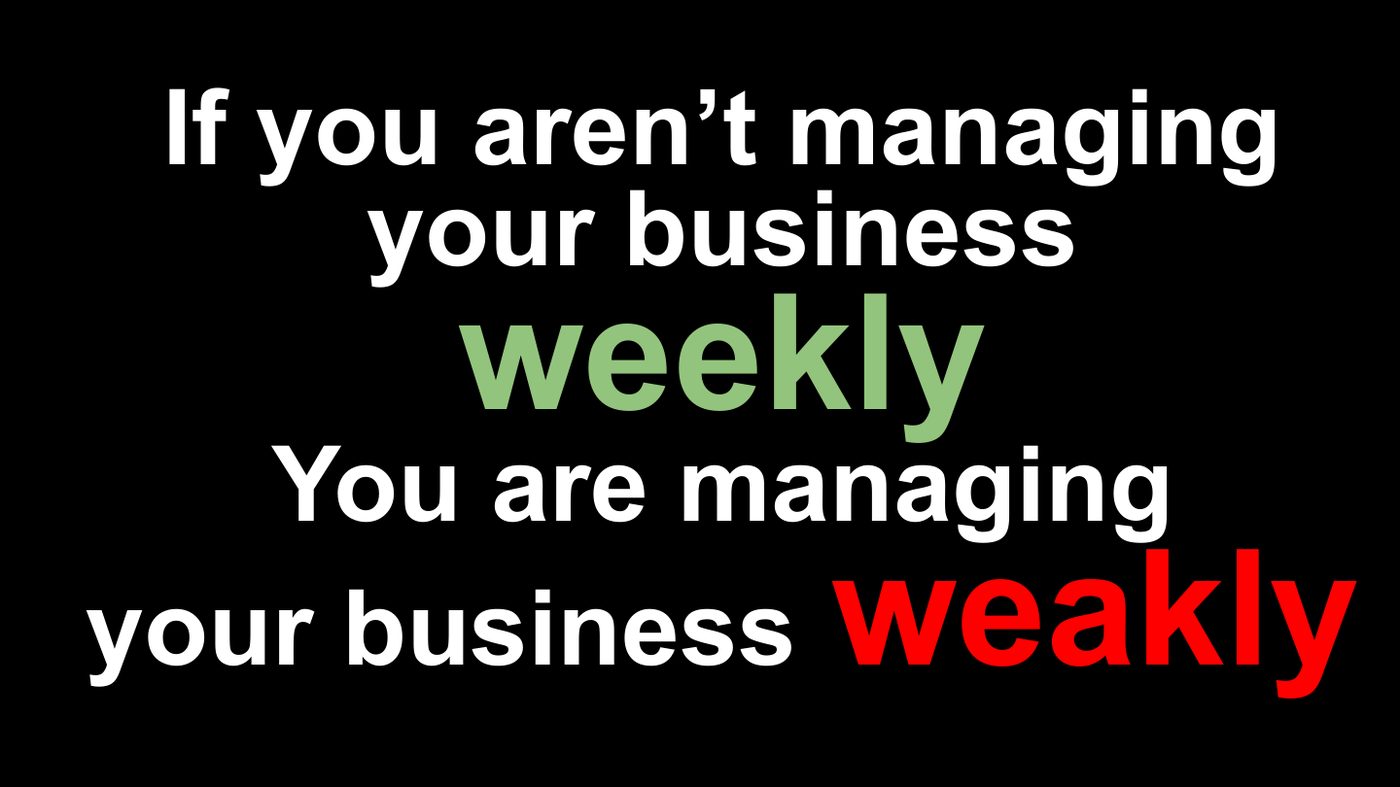
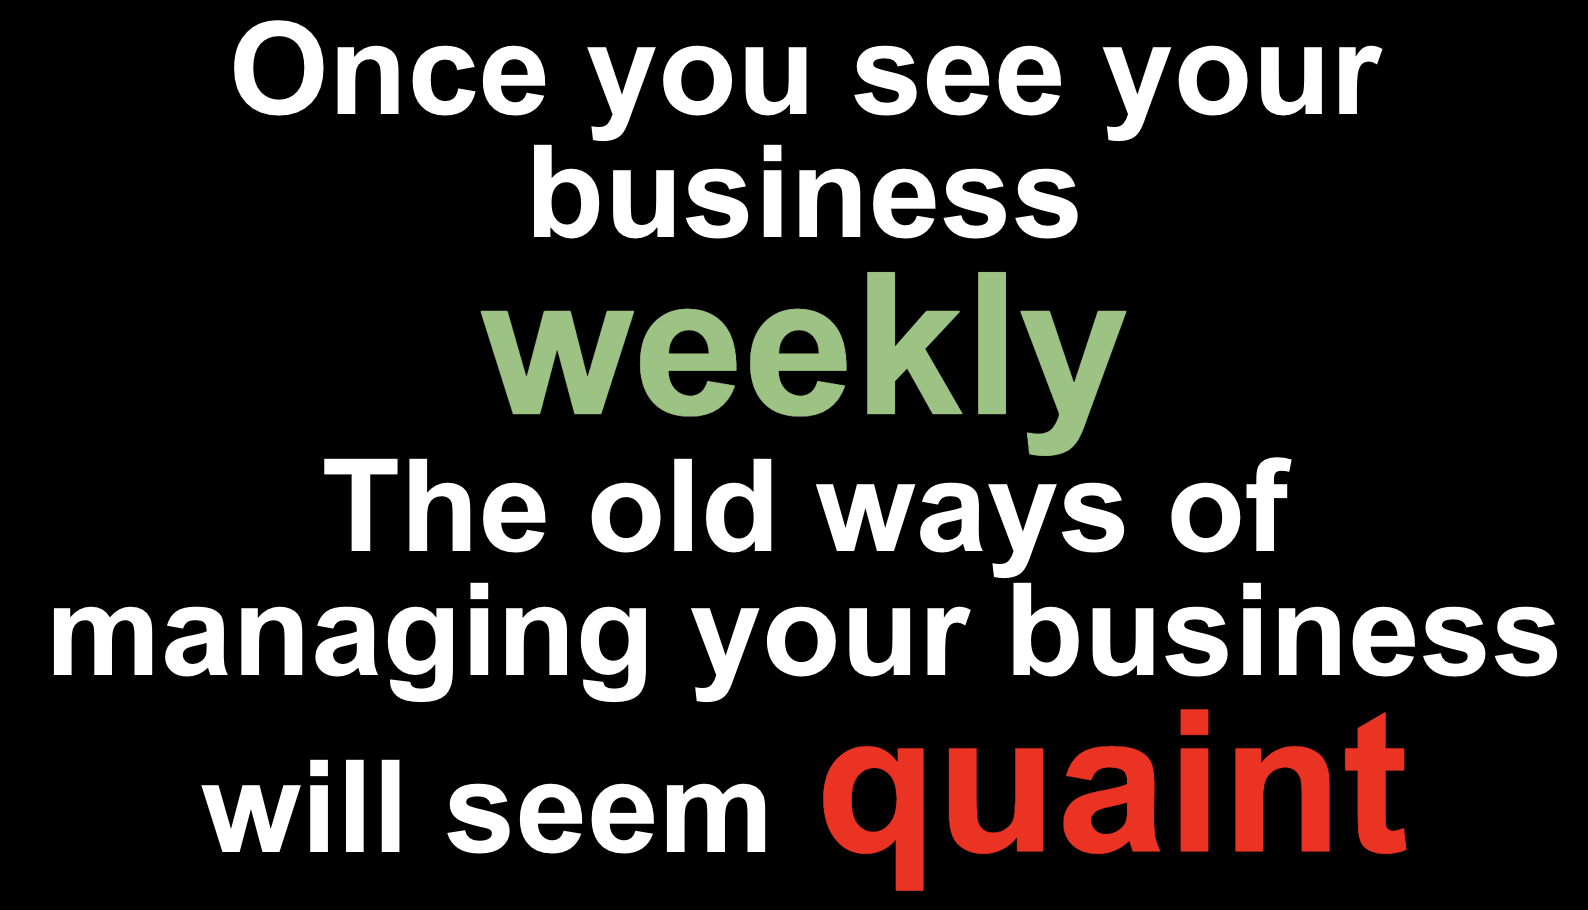
If you aren’t managing your business weekly, you’re managing your business weakly.
Why It Works
It works because when you put the right data in front of an empowered team, they get better.
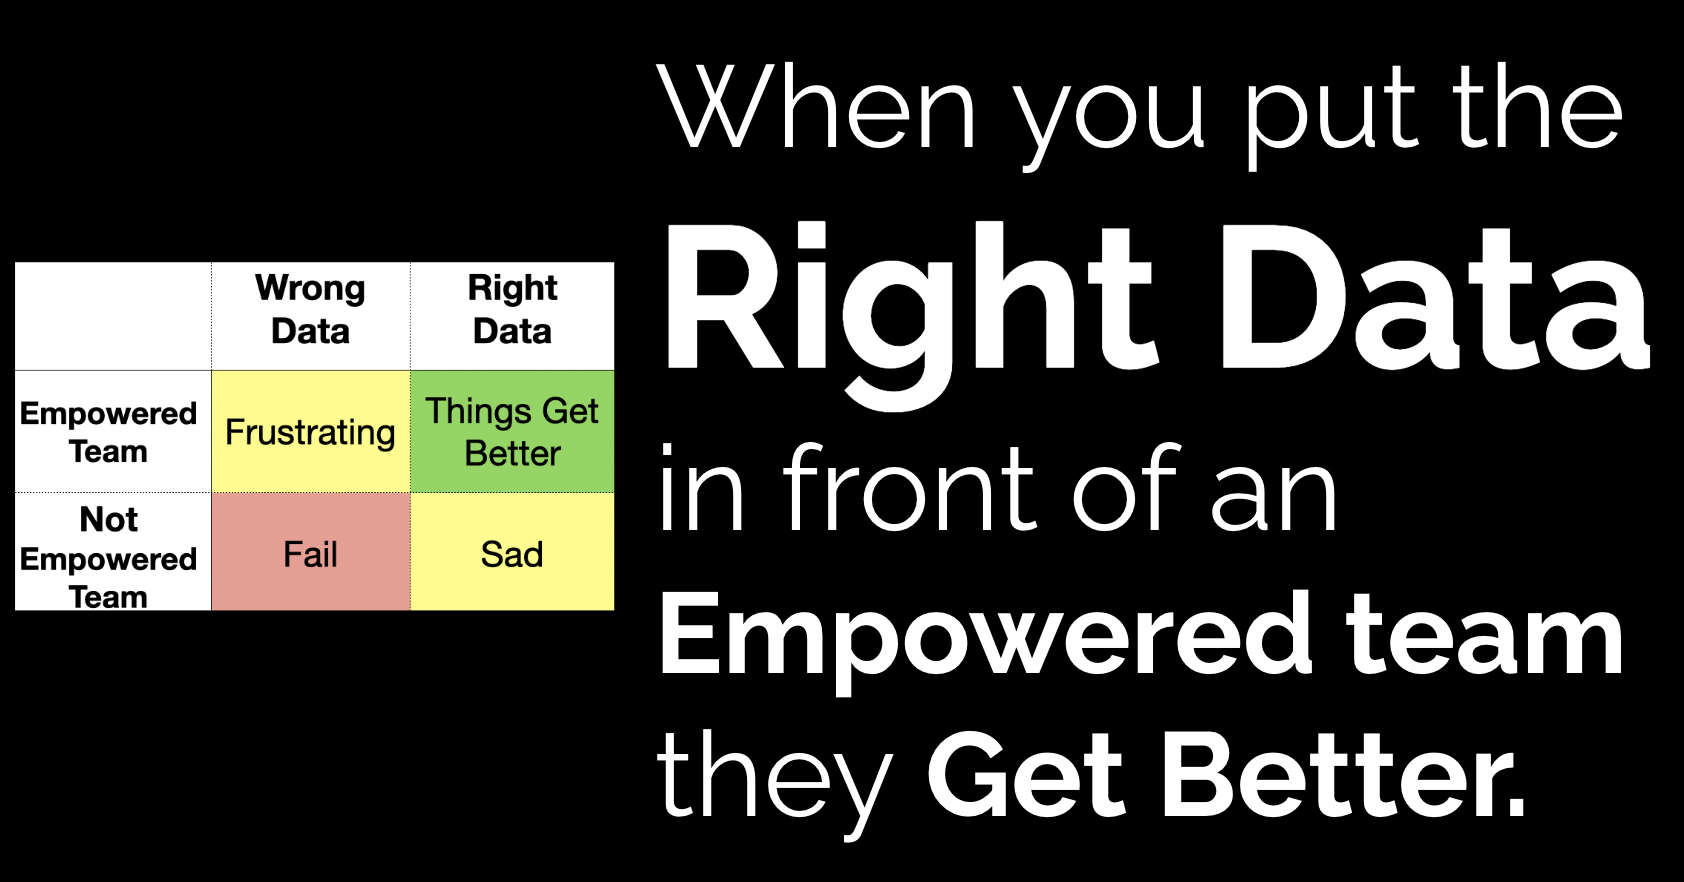
And what is the right data?
Unit Economics
When words and math combine to predict things, we call that science. This system is the science of forecasting your business with unit economics.
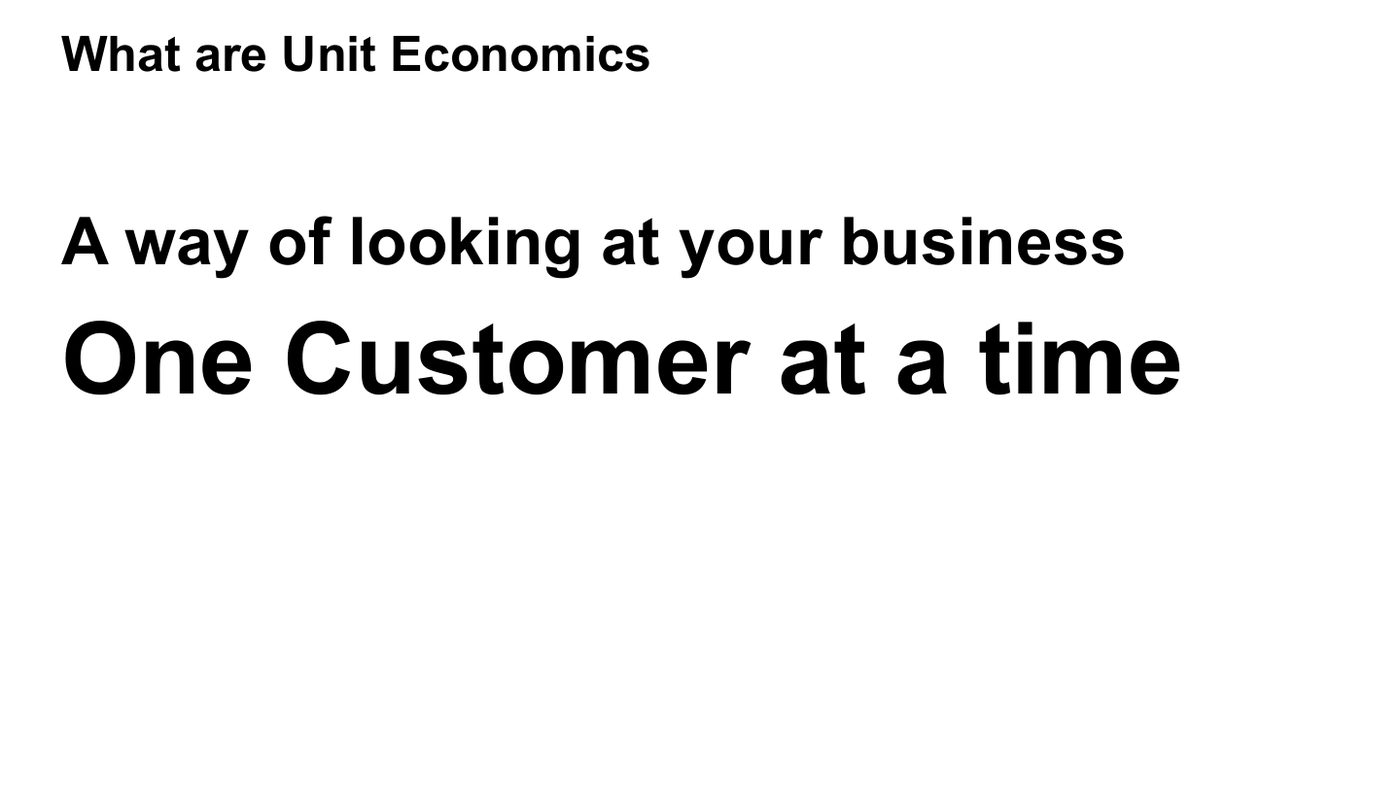
Unit economics is a way of looking at your business one customer at a time. It answers the most important questions:
- How much does it cost to acquire one customer?
- How many purchases per customer can I expect?
- What is the gross profit over that customer’s life?
Here’s what that looked like for Matt.
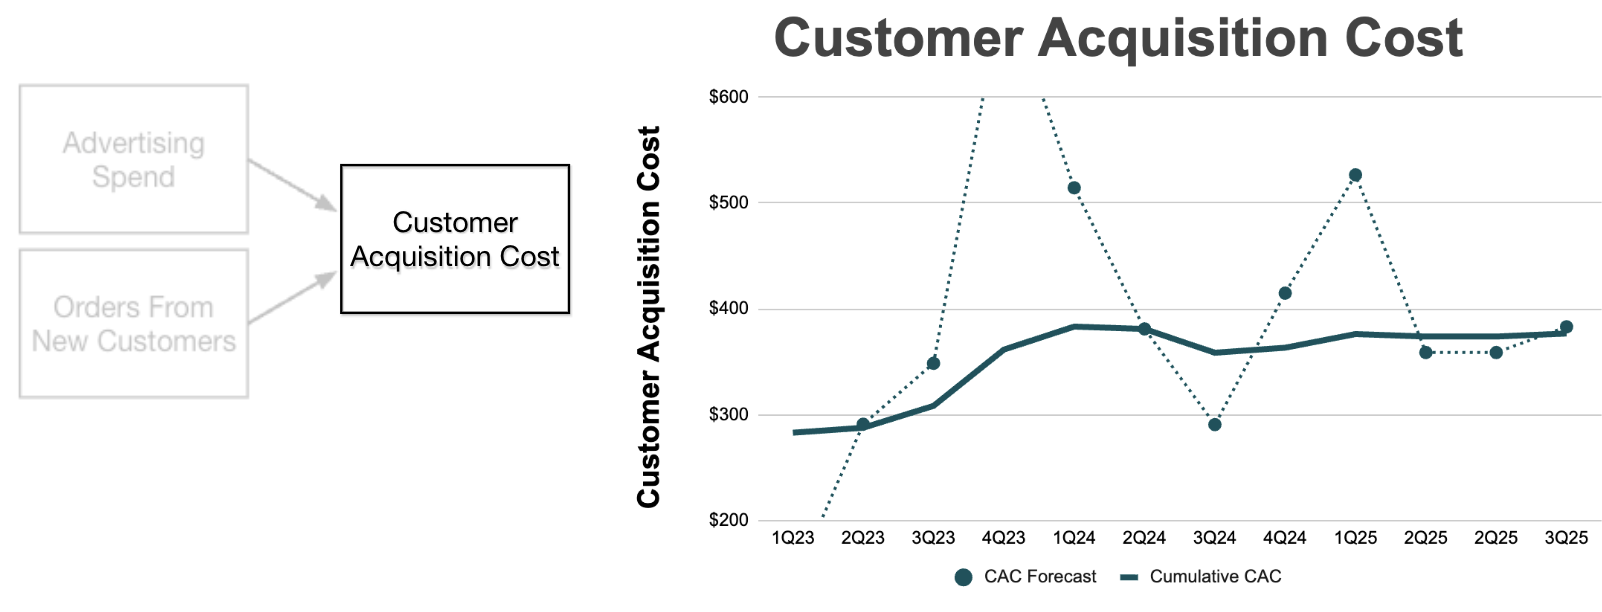
Customer Acquisition Cost
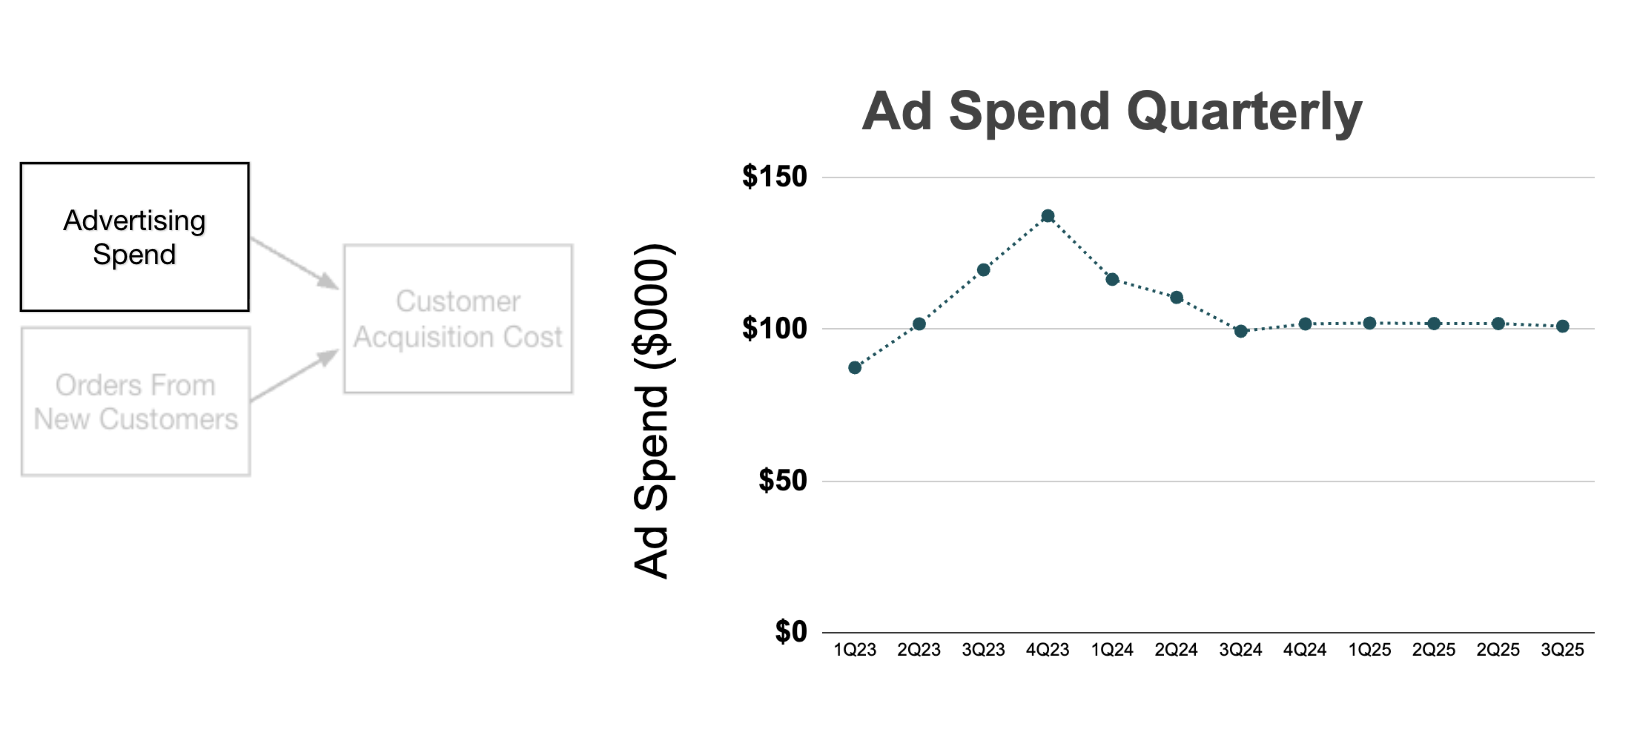
He spends about $100,000 per quarter on ads:
He gets between 200 and 400 new customers each quarter:
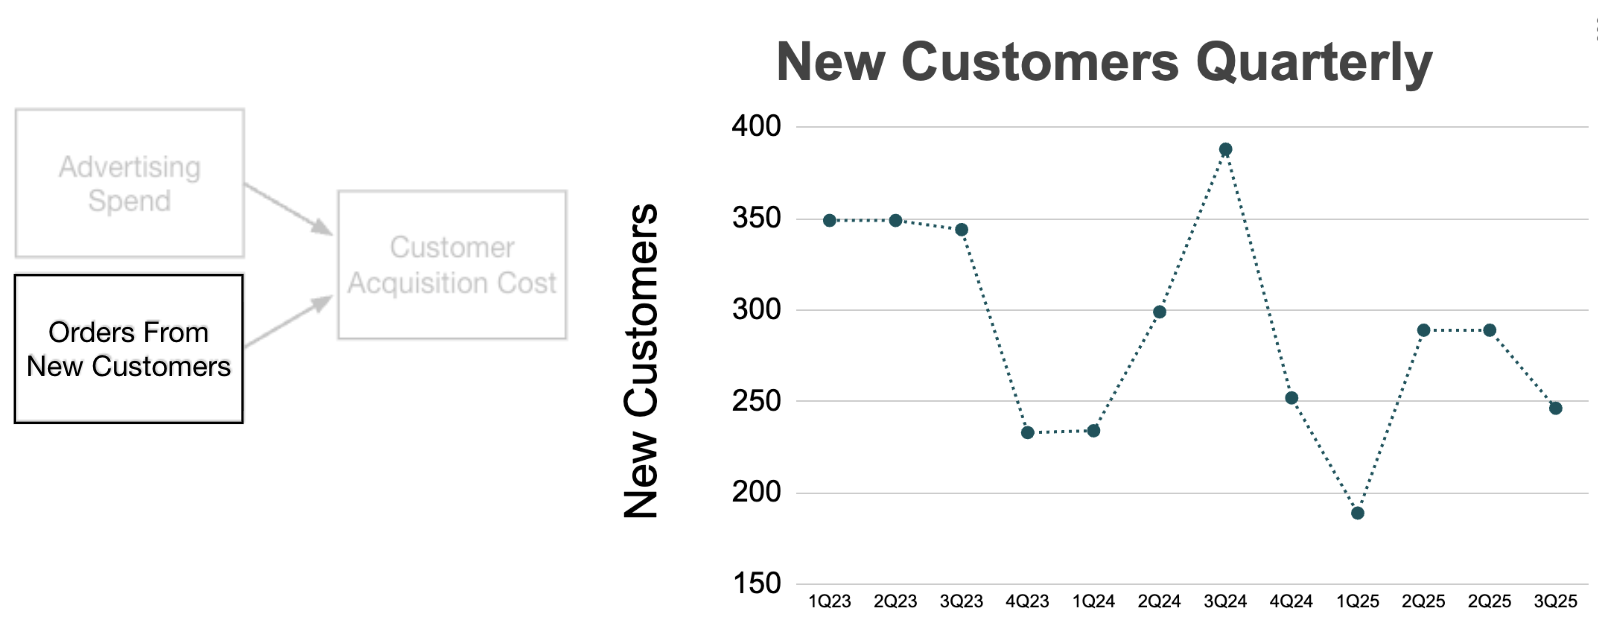
That’s a little under $400 to acquire a customer. Quarterly results fluctuate, but the dark line — cumulative customer acquisition cost — is smooth. That’s the signal in the noise. It’s simple: total ad spend for all time divided by total new customers ever acquired.
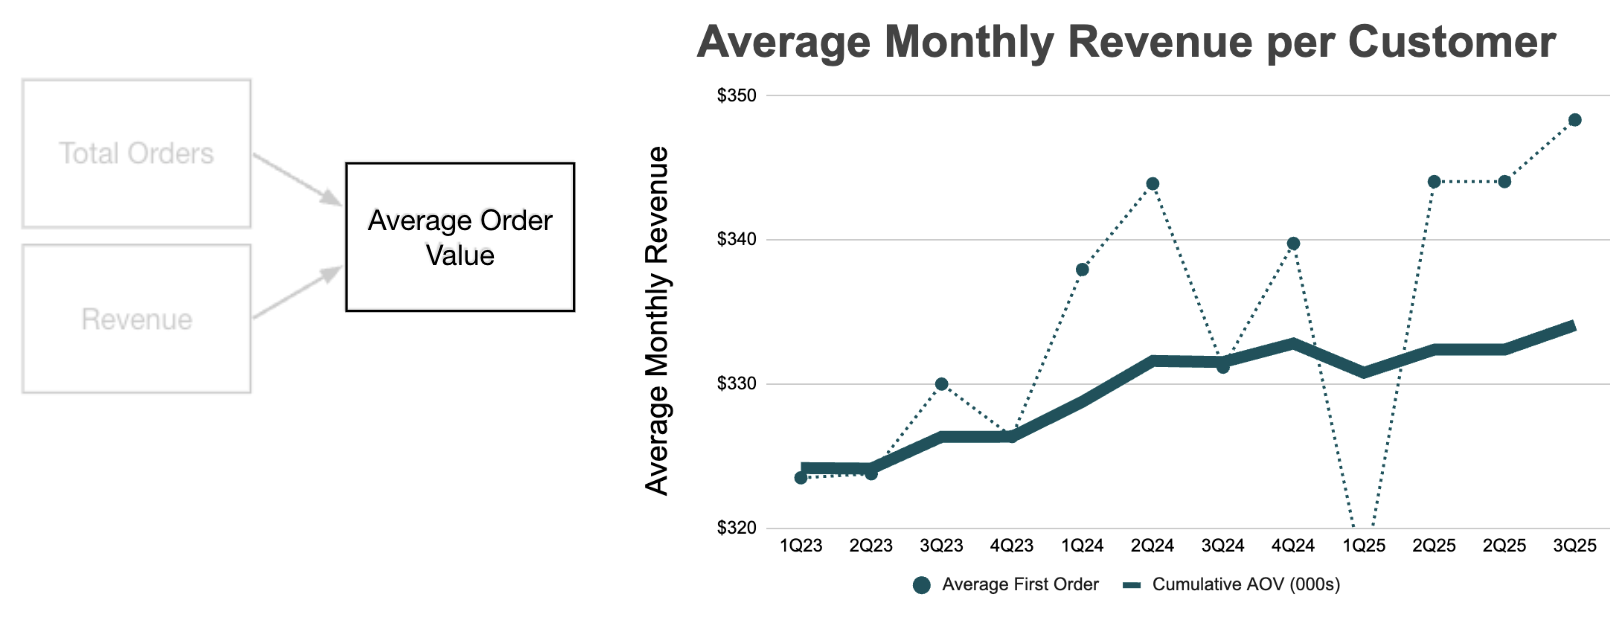
Average Order Value
Matt’s AOV rose from $325 to $335, and more recently about $345 per customer per month:
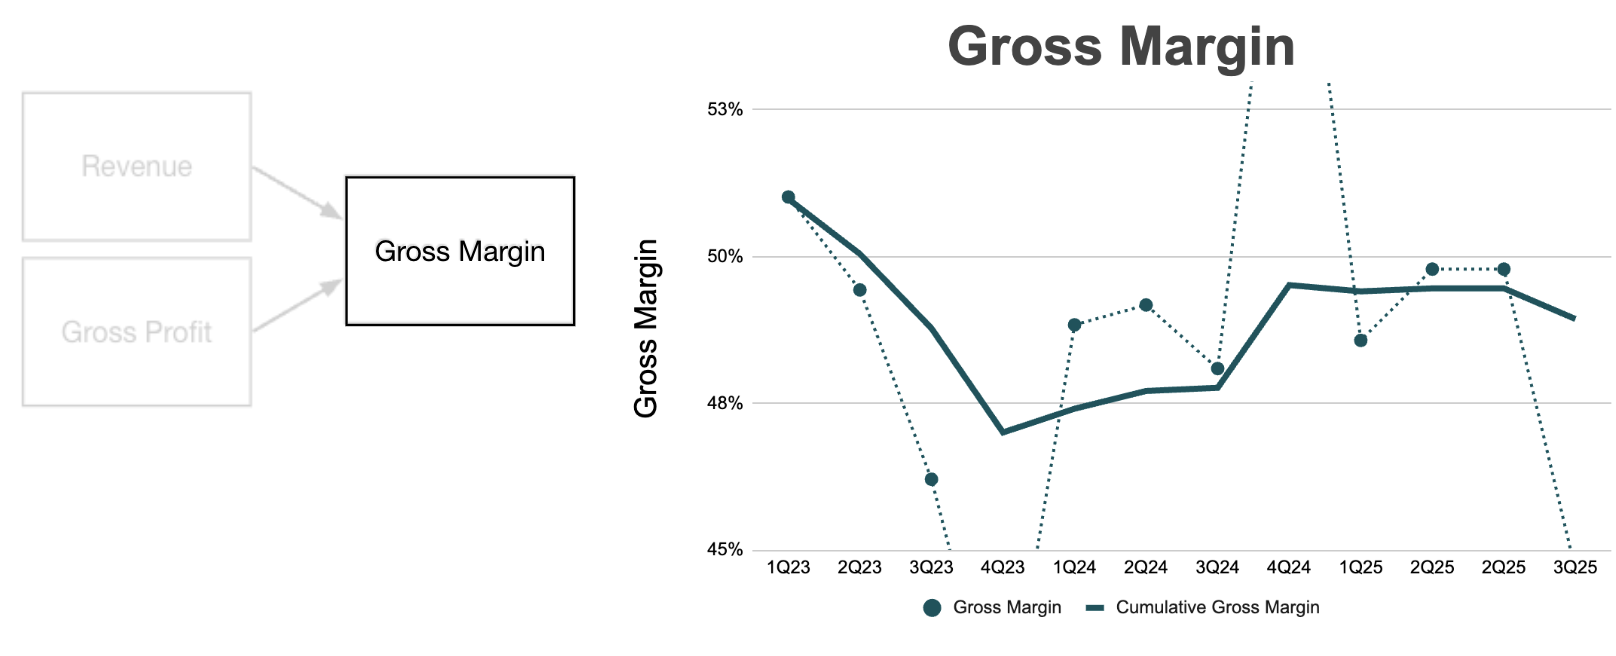
Gross Margin
Fluctuates just below 50%:
Repeat Purchases
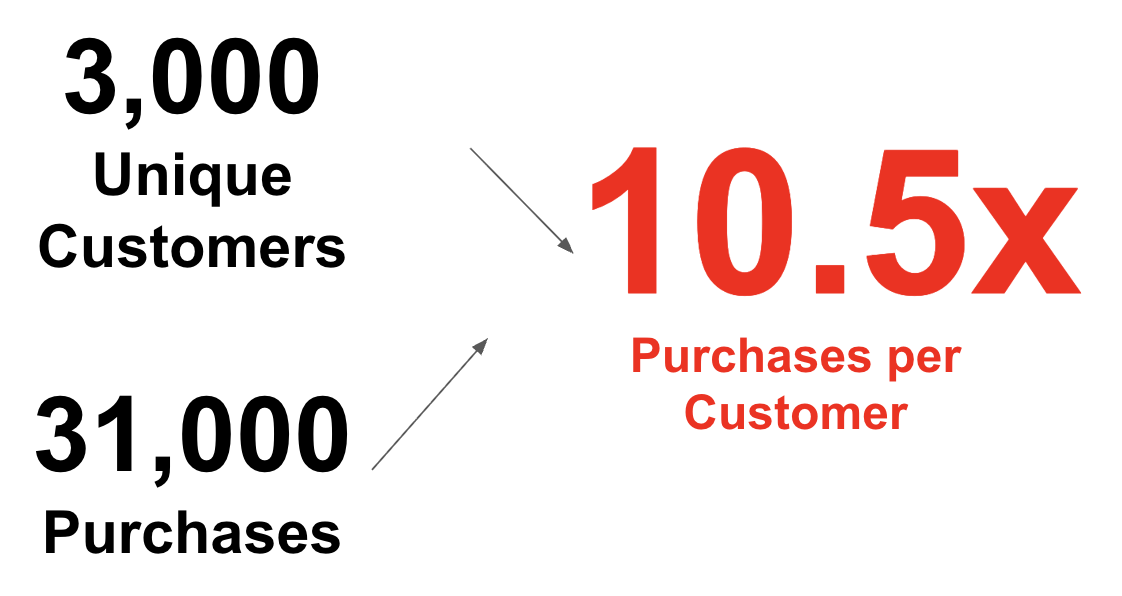
Many people do cohort analysis to understand customer life. Cohort analysis is complicated and hides the true picture. We simply look at the business’s order table — the data table where they bill every customer.
From 31,000 purchases across 3,000 unique customers, we see 10.5 purchases per customer:
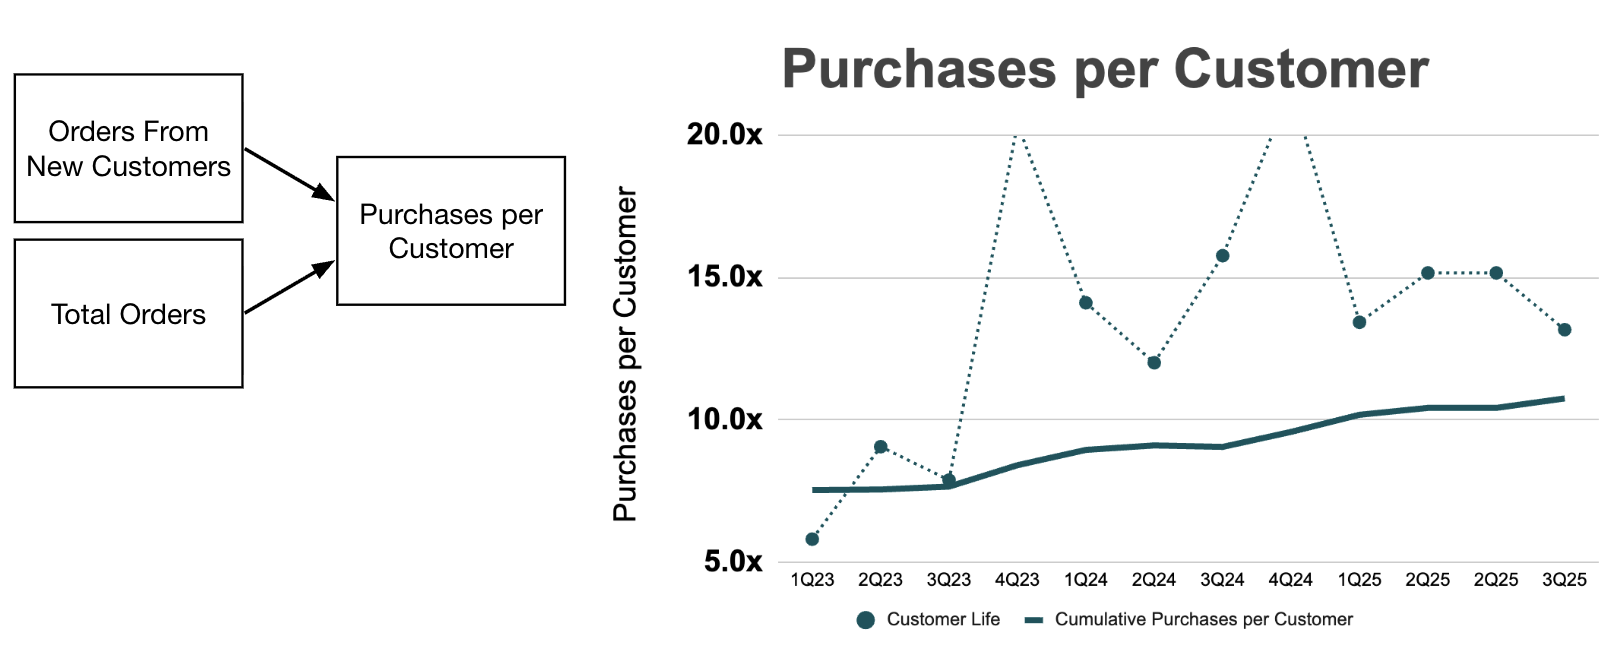
Lately, customer life has been about 15 months:
Lifetime Gross Profit
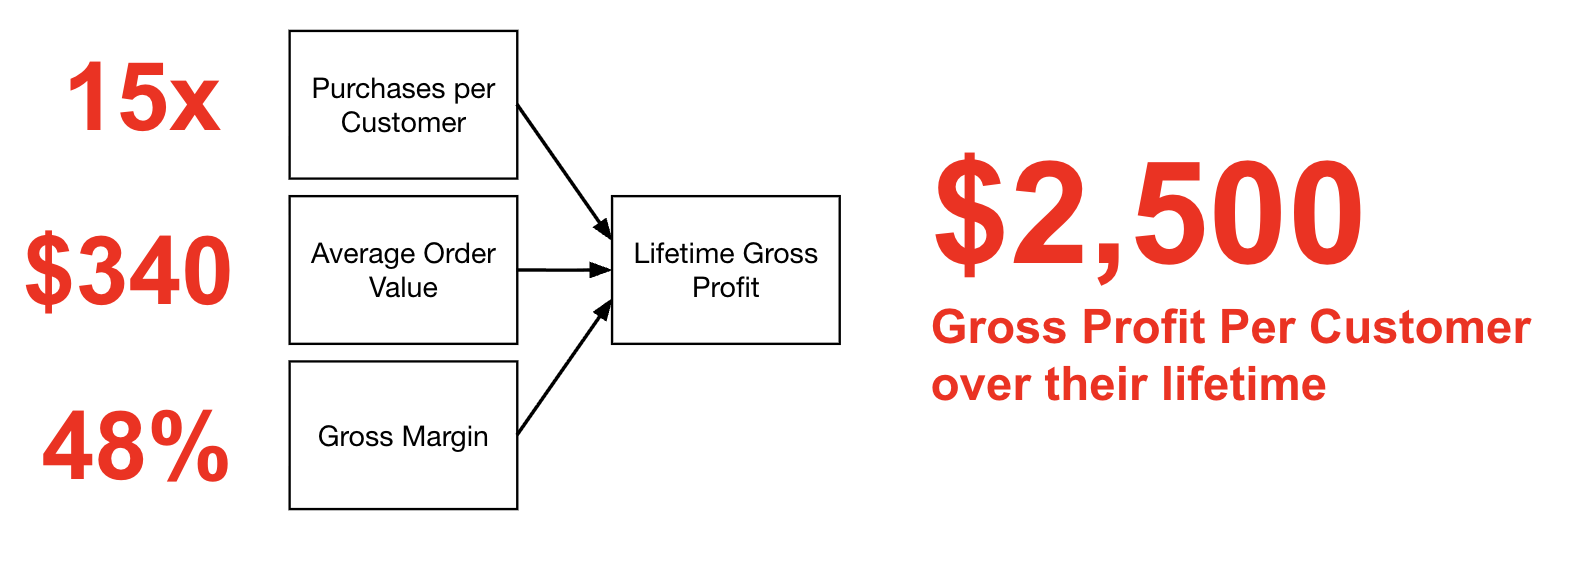
That gives Matt about $2,500 in gross profit per customer lifetime:
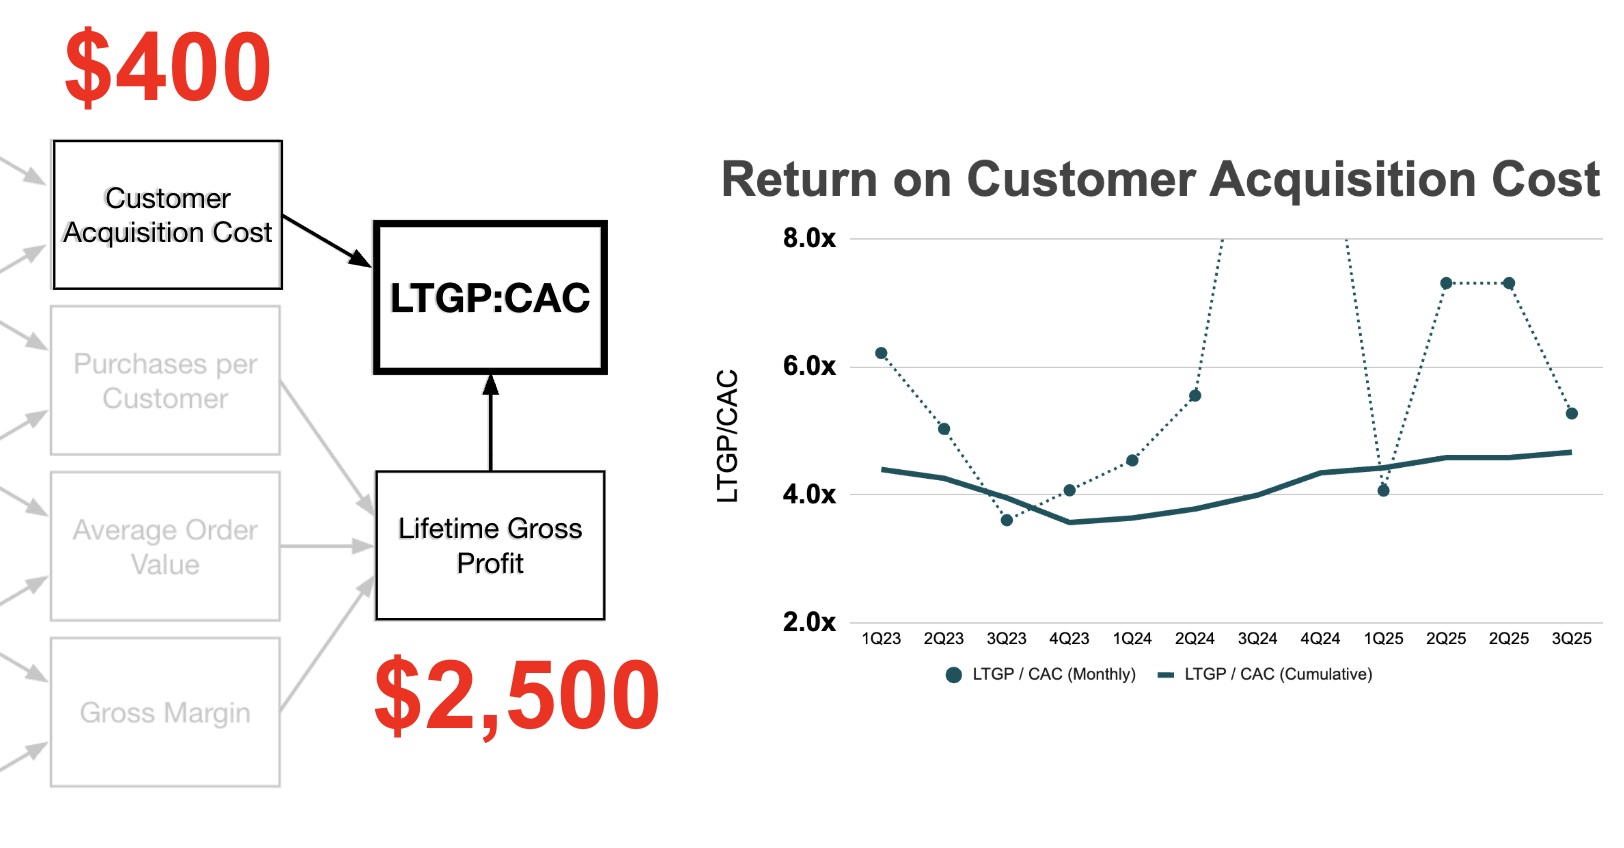
Divide that by his CAC, and you get a 4–6x return on customer acquisition cost:
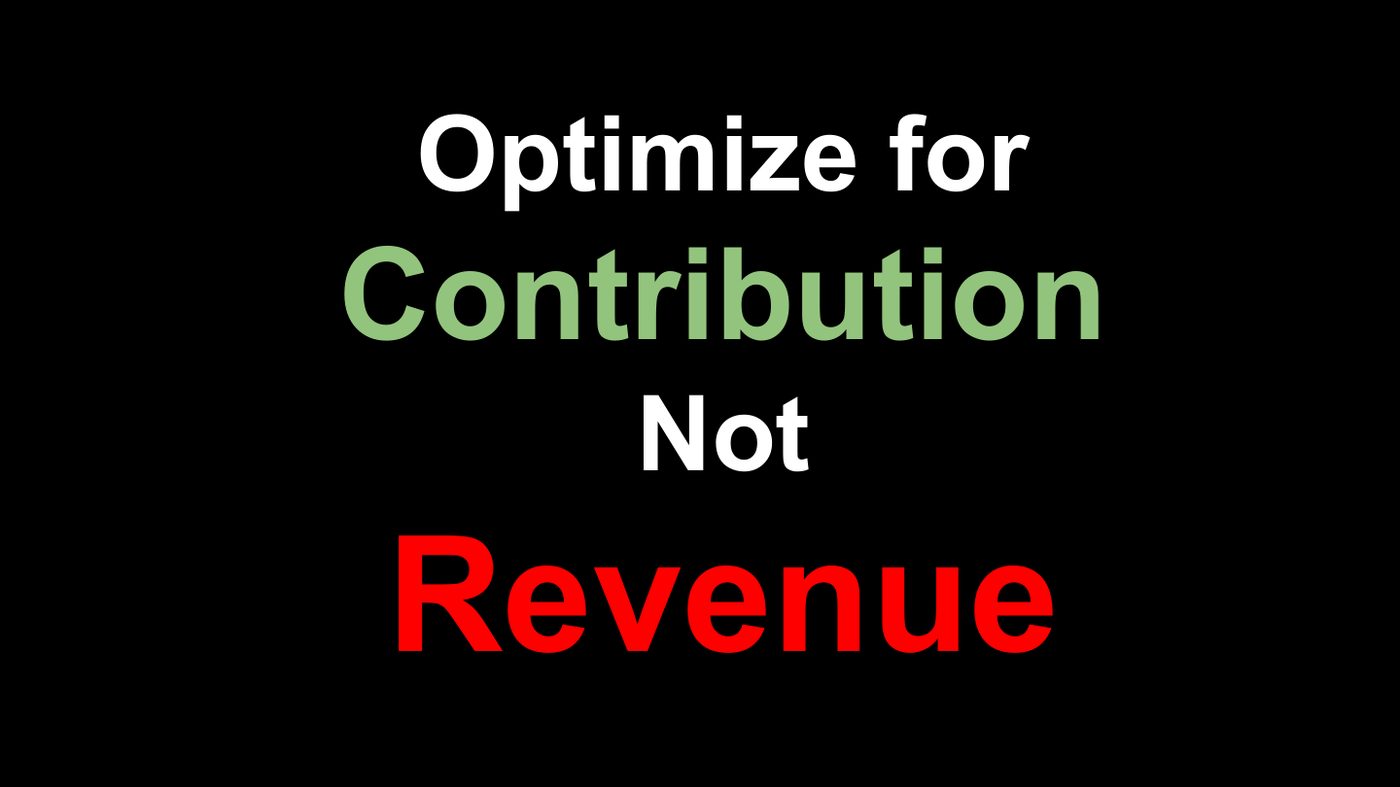
Focus on Contribution, Not Revenue
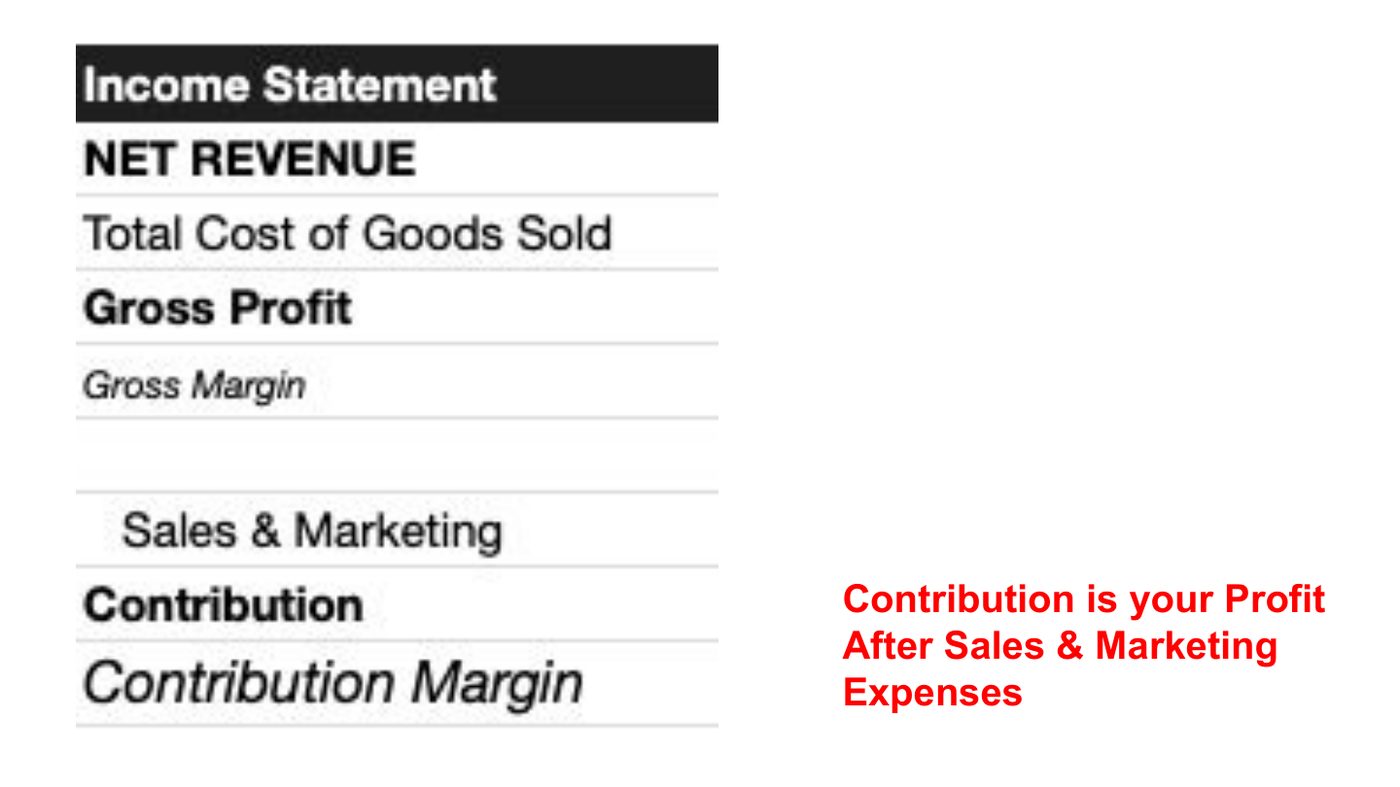
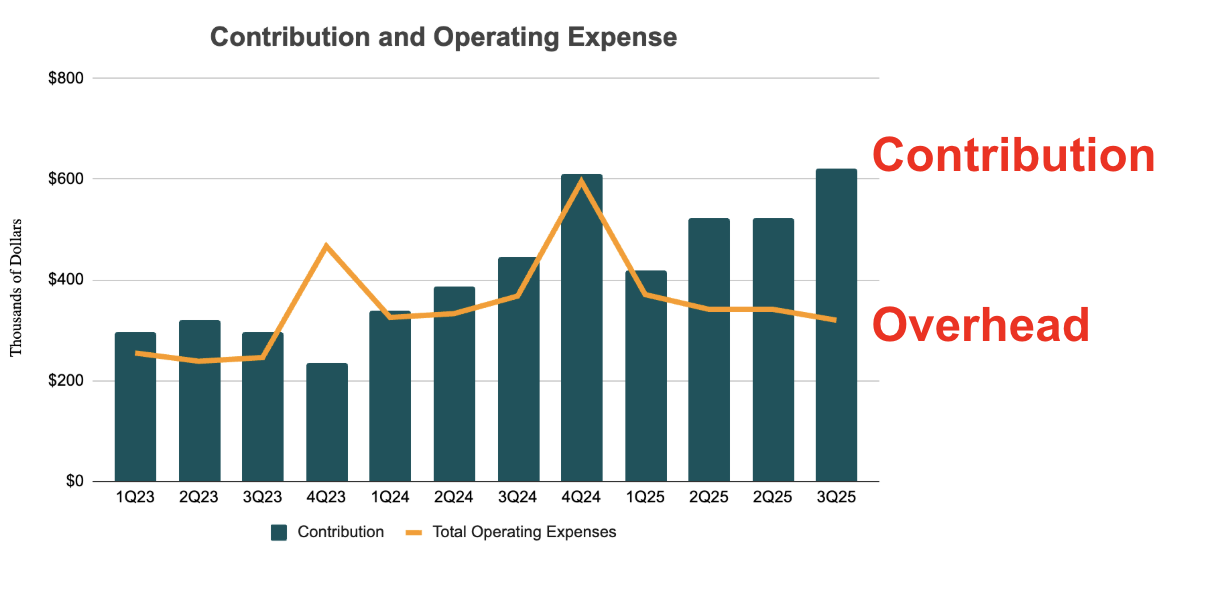
Contribution is gross profit after sales and marketing. Contribution margin is contribution divided by net revenue.
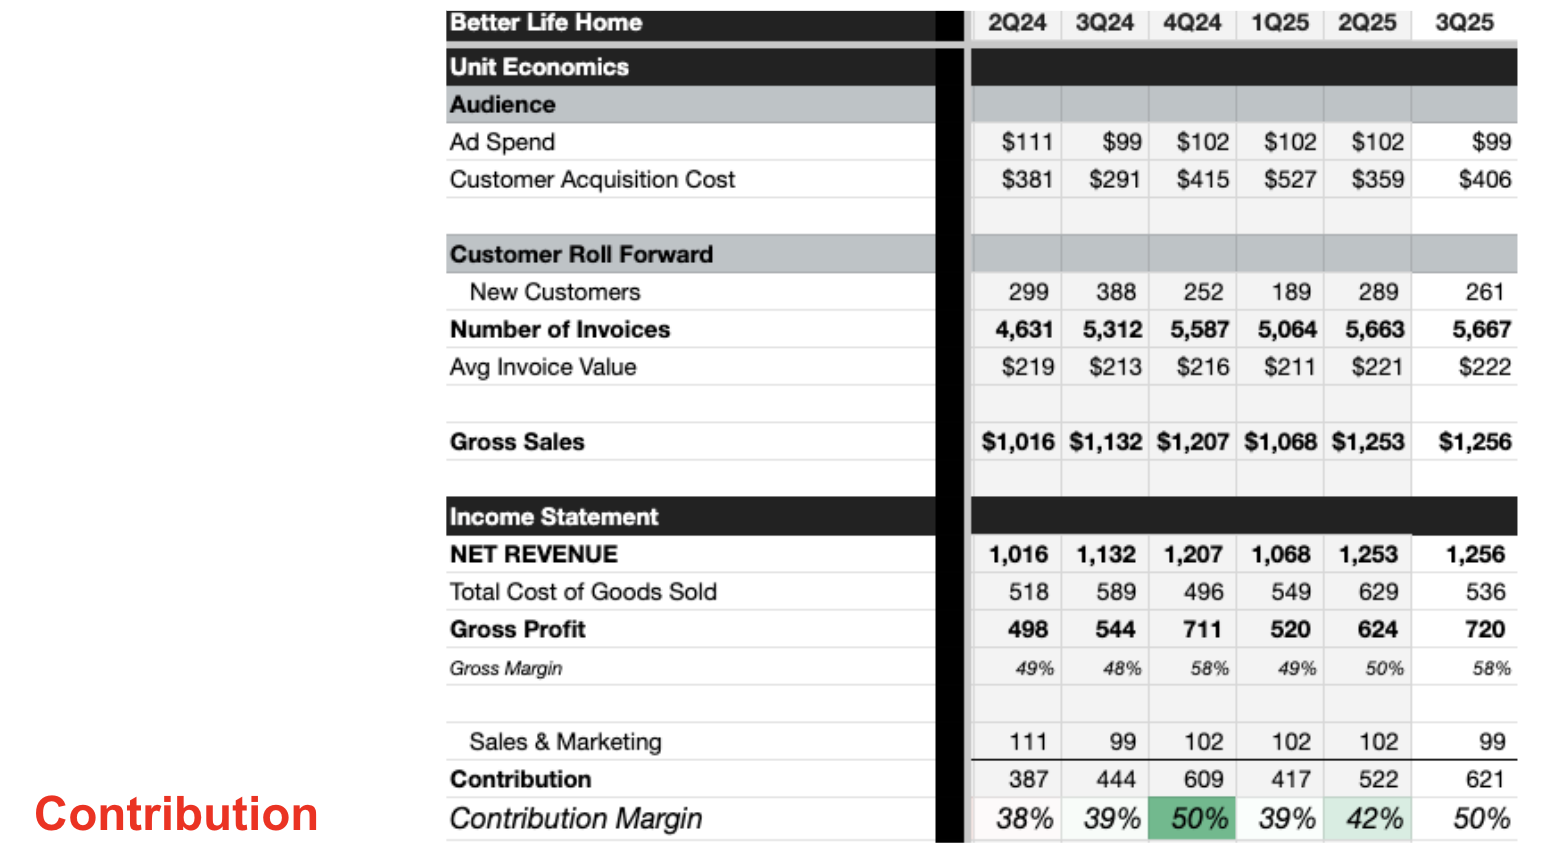
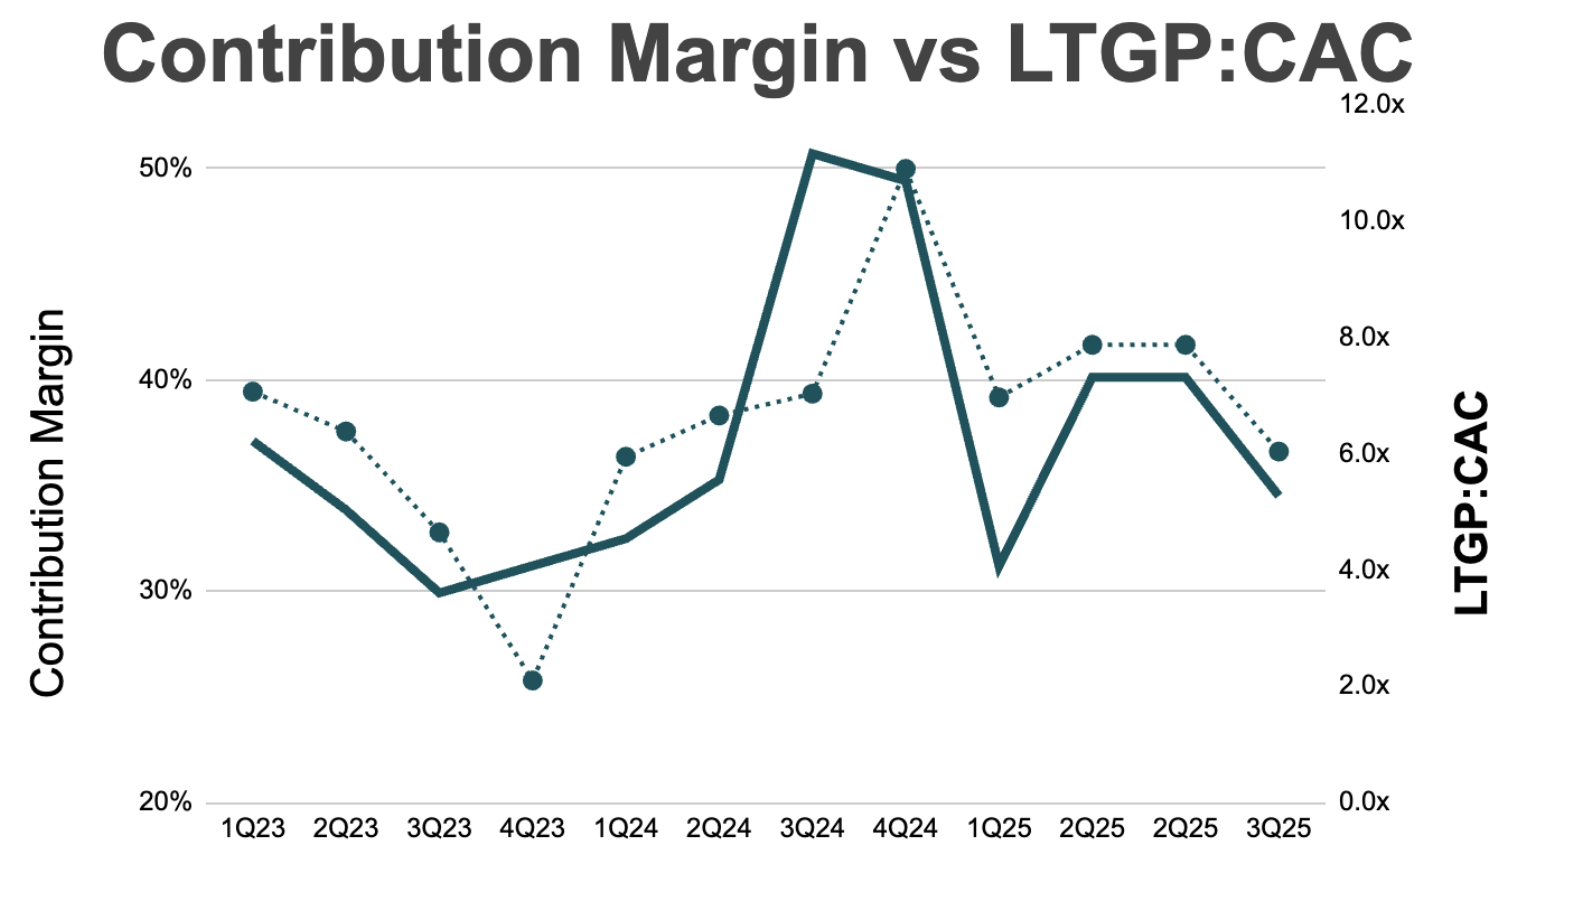
Lifetime gross profit to CAC closely resembles contribution margin:
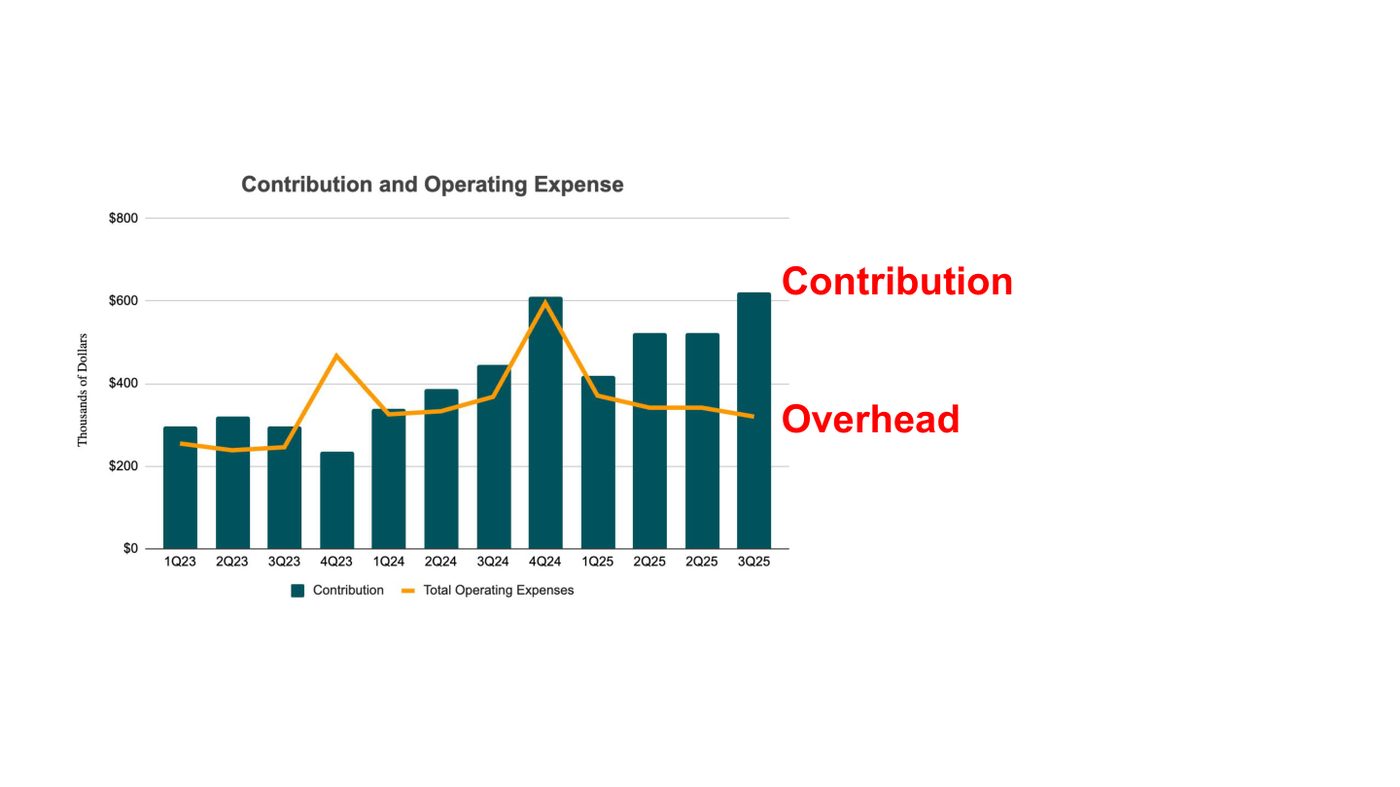
The Contribution Engine spans the business from the widest part of the sales and marketing funnel, through payments from new and repeat customers, to delivering on the promise. This is the engine that generates profit for the company. Everything else is overhead. To be profitable, contribution must be greater than overhead.
Seek Growth Limits Courageously
Unit economics also answers another very important question: how much can I grow?

Sometimes cash is the limiter of growth. Sometimes capacity. Sometimes we get in our own way — and sometimes the market tells us the truth.
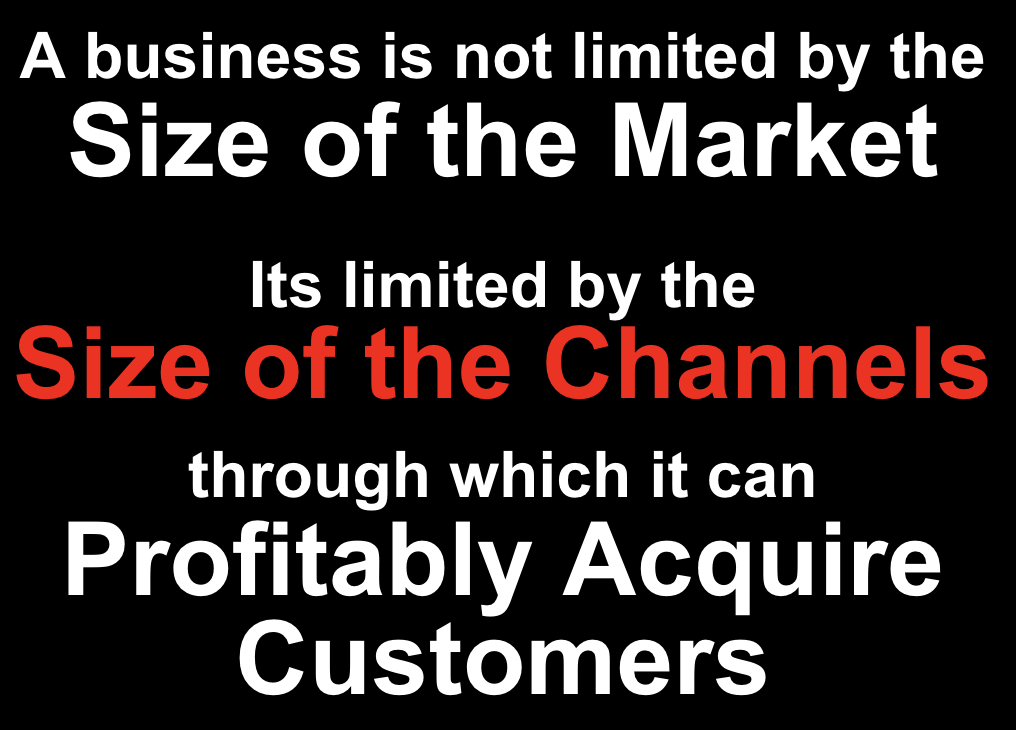
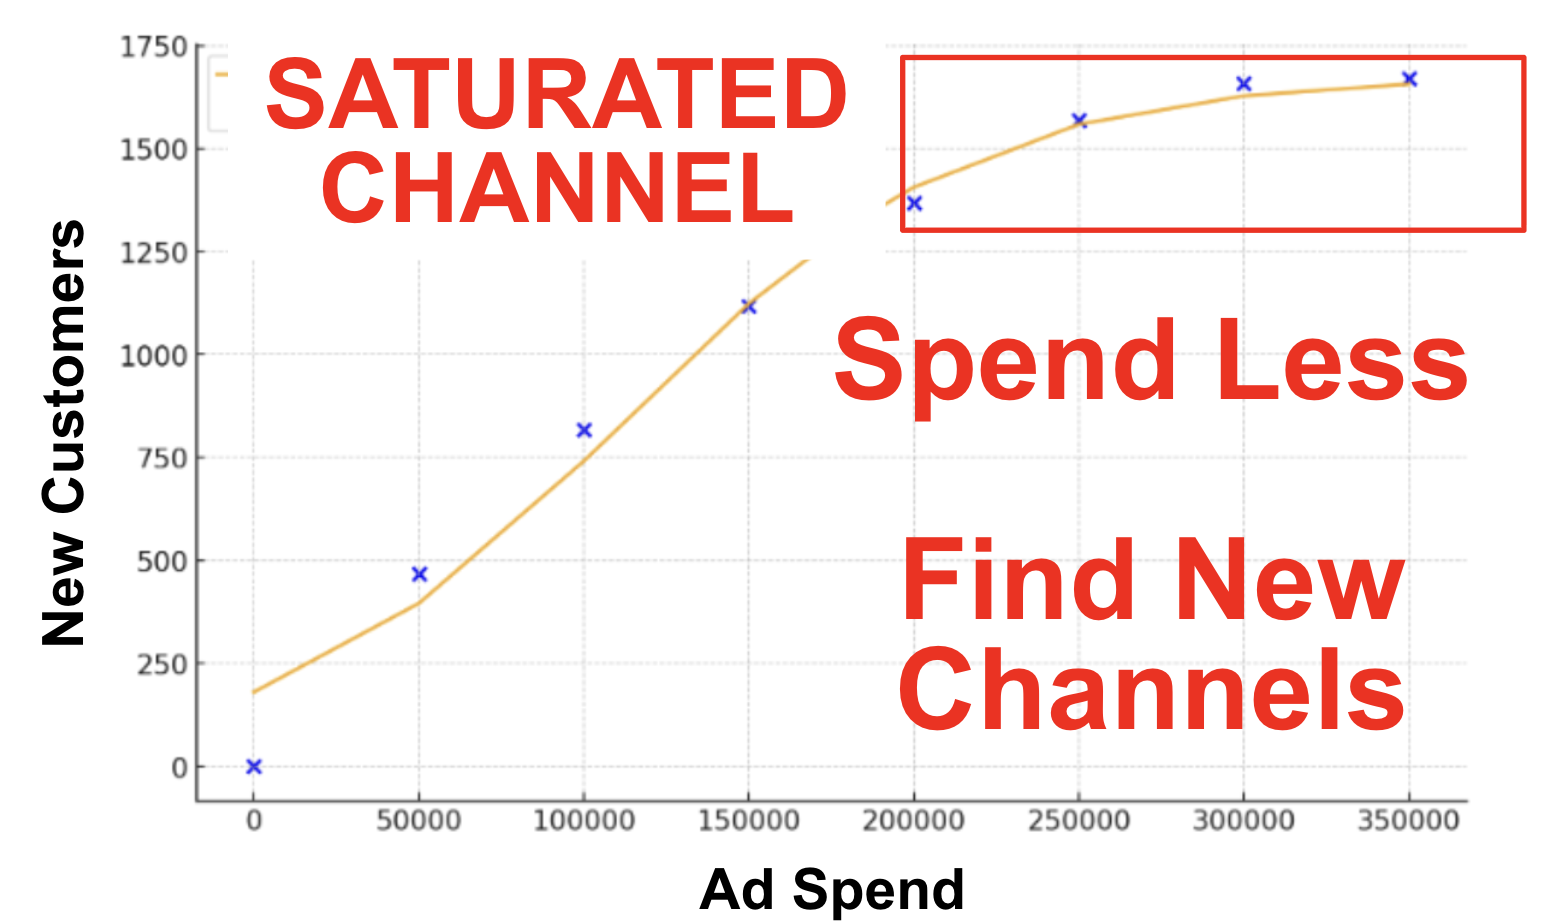
Every Channel Saturates
It’s a core tenet:
Example: a business spent $300,000 to acquire 1,600 customers. Then $350,000 to acquire the same 1,600 customers:
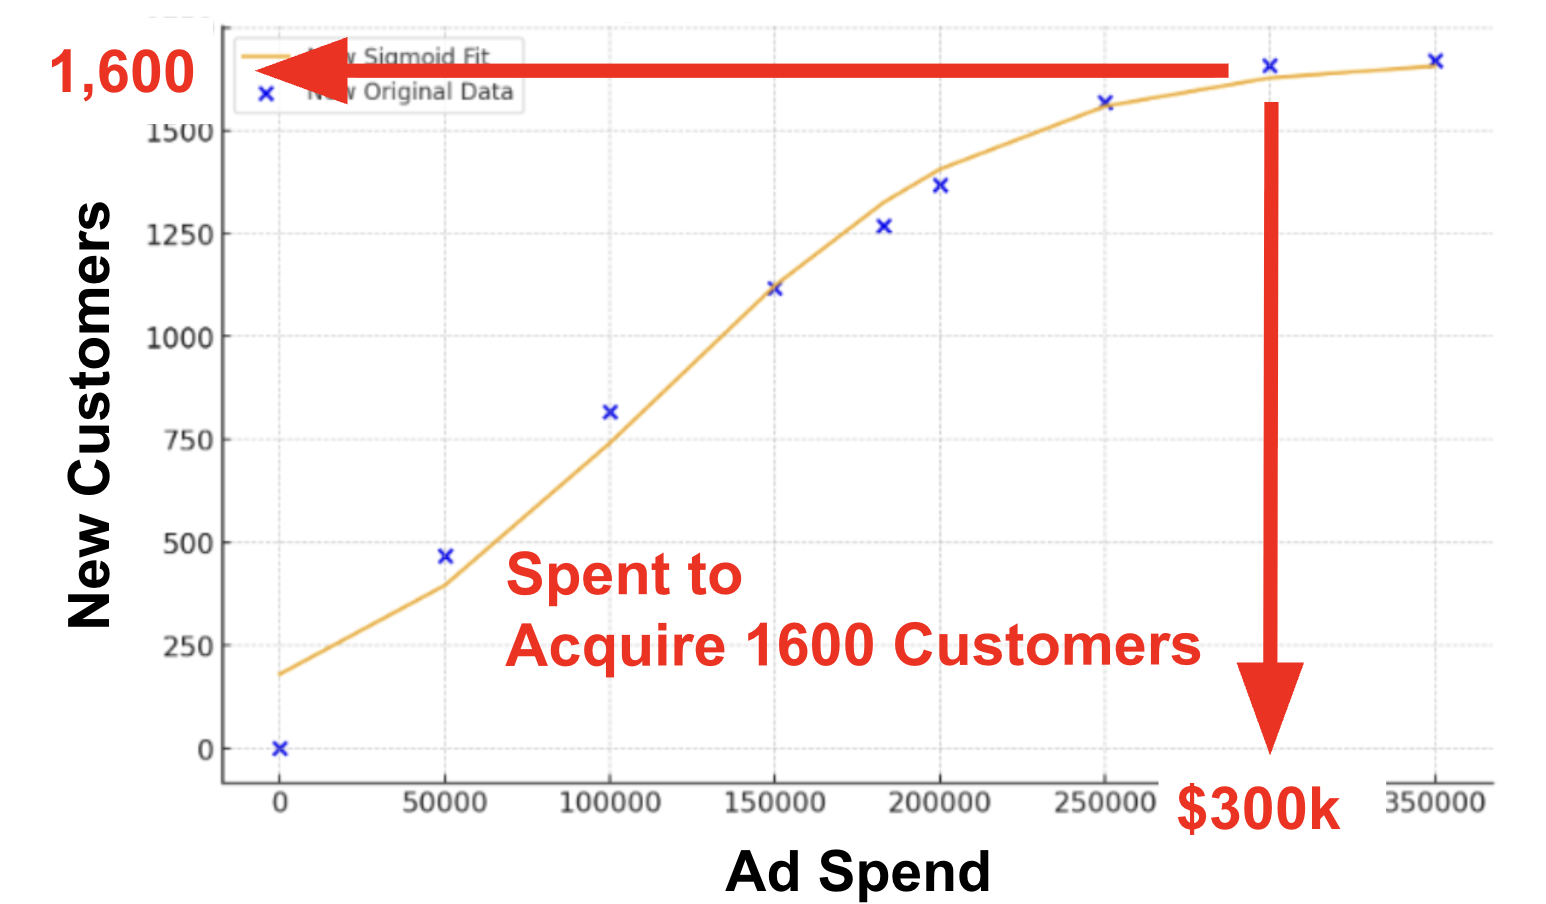
That’s a saturated channel. Time to spend less there, and find new channels to grow:
Unit economics are a powerful map to understanding and forecasting a business.
Want This Analysis for Your Business?

Email Z@WeeklyAccounting.com — we believe in the Spirit of the Gift. (That’s yoga-babble for a free trial.)

© 2024 BrightZen Systems LLC. This piece is the introduction to the Weekly Accounting system — the Fourth Statement, the IFM, and Monday Morning Metrics are the instruments that make it real.