The model is large.
FleetBridge’s IFM — the Integrated Financial Model — has 71 tabs and 8.46 million cells. One workbook spanning January 2020 through January 2027. Eighty-four months of monthly columns, each wired to source tabs pulling transaction-level detail from QuickBooks. Revenue by customer across 6,778 rows. Expenses by vendor, by class, by week — 1,677 rows at 412 columns. A Monthly Management Model that runs 888 rows by 172 columns. An invoice and payments tab with 41,969 rows. A customer revenue source tab with 1,898 columns.
I live in these models.
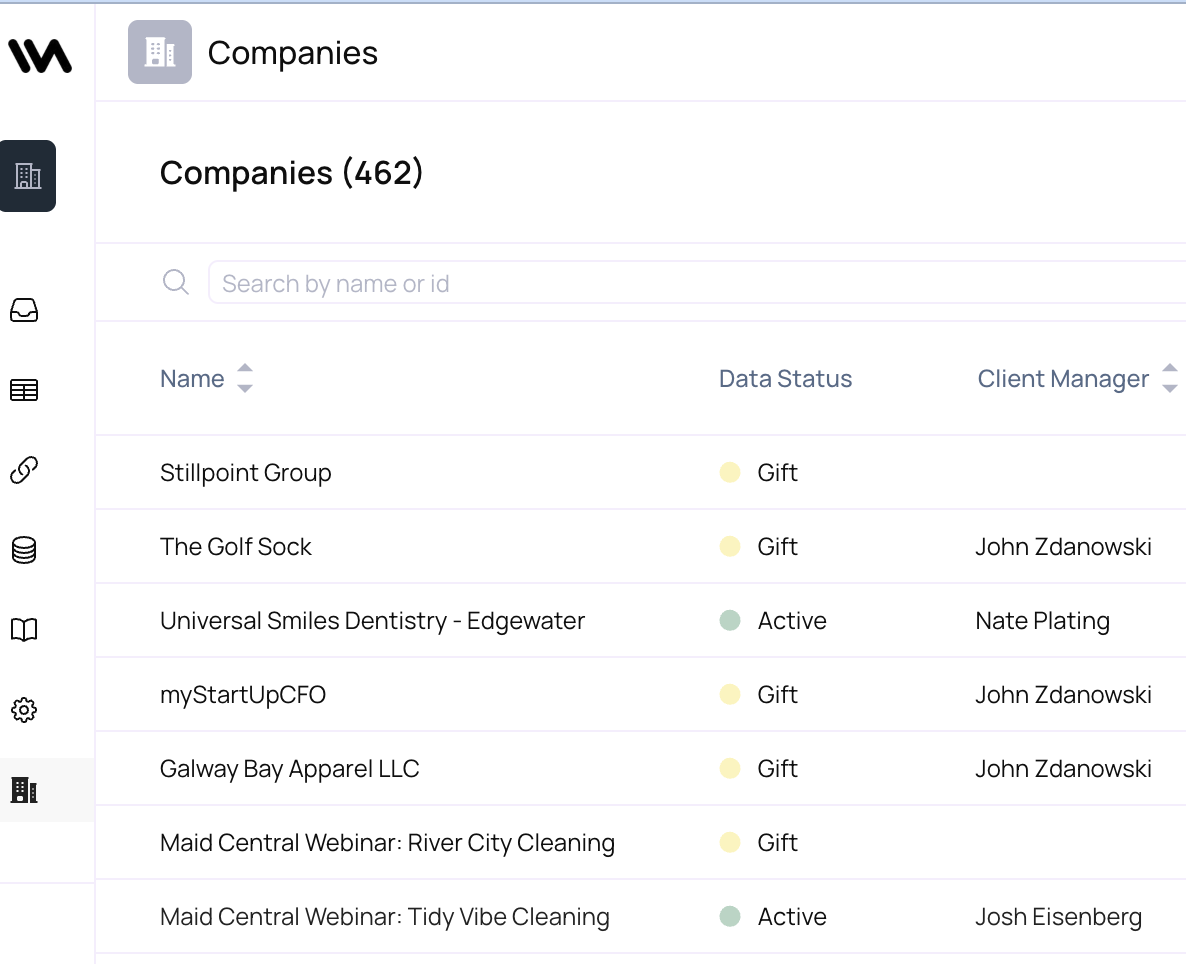
We have 462 companies on the Weekly Accounting platform.
Each one has a model built on this framework. Each model is a living system — not a static report, but a weekly pulse on cash, revenue, expenses, and the distance between where you are and where you need to be.
And yet. The moment that mattered most this week was about a single number.
Mark Feldman is the investor. Ryan Torres is the CEO. I’m the investor CFO — the person who builds and maintains the model, who translates between the language of operations and the language of capital.
Mark wrote a document. Simple, direct: this is what I need to feel comfortable. Not a spreadsheet. Not a formula. Just a clear statement of what the investment needed to look like for him to keep going.
Ryan read it. And here’s what he said:
“What he’s really talking about is the delta between the cash flow and the funding target, if the amount of funding fluctuates. That’s actually what he’s looking for. I just turned his intention into a KPI.”
He called it the Margin of Safety.
Here’s what Ryan built, in the first eleven rows of a model with 8.46 million cells:
Row 4 — Target Capital Raised: $6,000,000. This is Mark’s number. The amount of total funding that needs to come in for him to feel comfortable with the path to profitability. It’s a constant — hardcoded across every month in the forecast.
Row 5 — Capital Raised: $3,194,000. What FleetBridge has actually raised to date. Pulled directly from the balance sheet source tab — row 623 of the IFM.
Row 6 — Capital To Fund: $2,806,000. The gap. Target minus raised. How much more needs to come in.
Row 7 — Negative Non-Equity Cash Flow: The monthly cash burn excluding capital raises. Each month’s change in cash minus the change in capital raised. This isolates the operational cash flow from the fundraising activity — it answers how fast are we spending money independent of how fast we’re raising it?
Row 8 — Cumulative Negative Cashflow to Profitability: The sum of all future negative non-equity cash flows from the current month through the projected profitability date. This is the total remaining cash the business will consume on its way to breakeven.
Row 9 — Cash On Hand: Current cash balance. Pulled from the balance sheet.
Row 10 — Cash Low Point: The minimum cash balance between now and profitability, looking forward across every remaining month in the forecast. The floor. The worst it gets.
Row 11 — Margin of Safety (MOS): Capital To Fund + Cash Low Point.
$2,806,000 + (−$2,040,000) = $766,000.
$766,000. That’s FleetBridge’s margin of safety on the path to profitability.
It means: if they raise the remaining $2.806 million to hit Mark’s $6 million target, their cash will bottom out at negative $2.04 million along the way — and they’ll still have $766,000 of breathing room between the plan and the floor.
Every assumption in the model — hiring, revenue growth, churn, burn rate, fundraising timing — flows through those 8.46 million cells and resolves into that single number. Close a new customer, the MOS moves. Lose one, it moves. Hire someone, it moves. Change the revenue forecast, it moves. It synthesizes everything into a single indicator that answers the only question the investor actually asked: are we going to make it?
I’ve been building these models since 2014. The Monthly Management Model — the MMM — was designed to give operators and investors a shared map of the business. Hundreds of metrics, rolling monthly, with quarterly trends layered on top.
The Margin of Safety was never in the model. In over a decade of building these things, across hundreds of companies, it wasn’t there. And it wasn’t there because the model builder can’t invent it. The model builder creates the territory. The KPI has to come from the people navigating it.
Mark stated the destination. Ryan drew the line from here to there. I asked him how he did it:
“It was the first thing I did when I read Mark’s document. I said, okay — well, let me make a KPI out of this. I just took his intention and turned it into a formula.”
That’s the triangle that makes this work: the investor who knows what “comfortable” looks like, the CEO who can translate that into a calculation, and the model that holds it all together — 71 tabs, 8.46 million cells — so that one number can mean something.
The model doesn’t produce the insight. The model produces the conditions for insight. It’s the reason Ryan could read a one-page investor memo and, in a single sitting, turn it into a KPI that synthesizes every decision in the business into a single number.
He didn’t have to go build a spreadsheet. The spreadsheet was already there — dense, detailed, alive — waiting for someone to ask it the right question.
Ryan said it best: “We’re just adding little layers to this thing.”
Yeah. That’s how it works. One layer at a time, until the number that matters most is sitting right there in row 11.
What This Looks Like at Scale
Now imagine this running every day. Not a human reading 8.46 million cells — an AI analyst that lives inside the model, reads the source tabs as they sync from QuickBooks, and posts a daily briefing to Slack. Here’s what that looks like for FleetBridge on a Wednesday morning:
🔔 FleetBridge Daily Briefing — Wed, June 18
MOS: $766K (up $34K from yesterday) Copper & Vine signed — contract revenue of $49,691 now in the forecast. Projected onboarding revenue pushes the Cash Low Point up by $34K, which flows straight to the Margin of Safety. MOS target is $1M. We’re at 77%.
💰 Cash Activity
- Received: GreenLeaf paid $45,293 (current invoice, on time). Tideline paid $14,852.
- Billed: CoreFreight invoice received for $16,182. Stonebridge Inc billed $25,200 for warehouse services.
- Net cash impact today: +$18,763
⚠️ AR Risk — Shipping Hold Watch Three customers approaching or past shipping hold thresholds:
- Ashford LLC — $10,798 at 91+ days, $11,323 total. No payment activity in 4 months. Recommend hold.
- Harborside Home — $3,916 at 91+ days. Last payment was March. Ryan should call.
- VaultCraft — $3,500 total, $1,060 now at 31-60 days. Trending the wrong direction. Flag for next week if no payment.
Meridian Co ($213,715 at 91+ days) remains on hold. No change.
📊 Pipeline — SQLs & MQLs 7 new SQLs in the last 7 days. On pace for the monthly target of 30.
- Summit Supply Solutions — inbound email, 6/16
- ClearPath, Inc. — website lead form via fleetbridge.com/contact, 6/16
- Ace Athletics — outbound extension, 6/15
- Nordic Power AB — organic search, 6/15
- Atlas Global Inc. — direct traffic, 6/15
Lead source mix: 3 organic/direct, 2 outbound (extension), 1 paid search, 1 inbound email. Organic is pulling its weight — the SEO investment from Q1 is showing up.
Ad spend this month: $30K Google Ads, $1K Bing. CAC tracking at $1,200/SQL against the $1,200 plan. Right on target.
📈 Month to Date
- June gross revenue: $1,397K actual vs. $1,401K forecast. Tracking within 0.3%.
- Gross margin: 33% (in line with trailing 3-month average).
- Operating income: on track for $(98K) — improvement from May’s $(147K).
Next update tomorrow at 8 AM. Reply in thread with questions.
That’s one model. One day. One Slack post.
Now multiply it by 462.
The model has always been the foundation. What changes is who — or what — is reading it. When the analyst lives inside the model, every row becomes a signal. Every change becomes a story. And the CEO gets a briefing that connects the dots between a new customer signing, three accounts going stale, a pipeline that’s on pace, and a single number that tells the investor whether it’s all going to work.
$766,000. Row 11. That’s the number.