Thirty Models. Thirty Stories.
I recently reviewed every Integrated Financial Model in a private portfolio — 30 companies across industries from dermatology to roofing, legal coaching to food intolerance test kits, mobile gaming trucks to $22 million travel membership businesses. Construction, e-commerce, SaaS, professional services, franchise licensing, even a private lending fund.
I didn’t look at the pitch decks. I didn’t read the narratives. I connected to the spreadsheets and read the numbers — actuals from QuickBooks, forecasts from the model, and the gap between the two.
What an IFM sees is not what a P&L shows. And the difference matters more than most CEOs realize.
The IFM Is Not a Financial Statement
The three traditional financial statements — Income Statement, Balance Sheet, Cash Flow — were designed for compliance. They tell regulators what happened. They answer the question: Did this business follow the rules?
An IFM answers a different question: Is this business healthy, and where is it heading?
It does this by layering three things the traditional statements can’t:
Unit economics. Not just “revenue was $3 million” — but how many customers, at what acquisition cost, with what repeat rate, generating what lifetime value. The IFM instruments the engine that produces revenue, not just the revenue itself.
Forward-looking projection. The IFM doesn’t stop at actuals. It projects forward using assumptions about growth, seasonality, customer behavior, and cost structure. And critically — it lets you see whether those assumptions are honest or delusional.
Integrated quality checks. The IFM runs an Error Checker that validates the accounting equation every month. If assets don’t equal liabilities plus equity — if the income statement doesn’t tie to the source data — the model screams. Most financial reports hide these inconsistencies. The IFM surfaces them.
What I Actually Check
When I review an IFM, I follow a specific sequence. Each step builds on the last, and problems compound downstream.
1. Are the Books Clean?
Before I look at a single revenue number, I check bookkeeping quality. Every bank account and credit card gets a pass/fail: Are transactions reconciled? How stale are the oldest unreconciled items? Is the “Ask My Accountant” bucket growing?
Across the portfolio, I found everything from pristine (Game Truck LLC — 13 bank accounts, all passing) to deeply troubled (Woodcrest — 17 of 18 accounts failing, with unreconciled items dating back years).
The bookkeeping quality check takes three API calls and tells me whether anything downstream can be trusted. When 75% of accounts are failing, I can still review the model structure — but the numbers inside it are unreliable. It’s like inspecting the blueprints of a house that was built with warped lumber.
2. Where Do Actuals End and Fantasy Begin?
Every IFM has a boundary — a date where real data from QuickBooks stops and projected numbers begin. This boundary is supposed to be set explicitly. In practice, it was blank or stale in nearly 40% of the models I reviewed.
That means the model can’t tell its own user where the facts end and the guesses start. For a CEO looking at the IFM, this is like reading a news article where the editor forgot to mark which paragraphs are reporting and which are opinion.
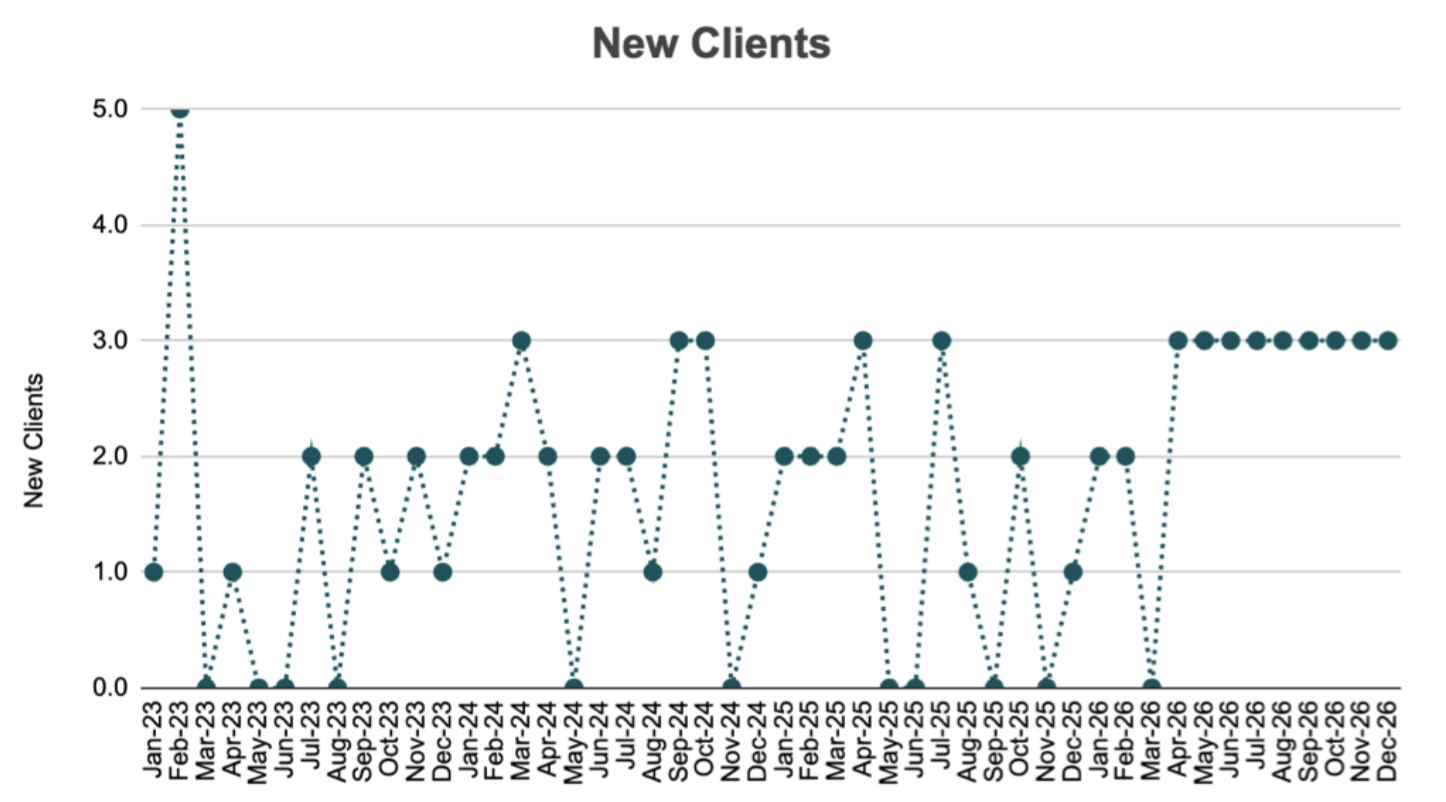 New client acquisition in a real IFM. Notice where the actuals end and the forecast begins — reality is volatile; the projection is a flatline. That’s not a plan. That’s a wish.
3. Does the Error Checker Pass?
The Error Checker validates the model’s math — does the accounting equation hold? Do the income statement and balance sheet tie back to the source data?
Most models pass. But when one doesn’t, it’s serious. One portfolio company showed a $2 million imbalance in the accounting equation — not because the math was wrong, but because the Error Checker was comparing values at different scales. Another had a $50,000 imbalance concentrated in the most recent forecast month. These aren’t rounding errors. They’re structural breaks that invalidate everything the model projects.
4. Is the Revenue Story Honest?
This is where it gets interesting — and where most forecasts fall apart.
I look at actuals first. Real revenue, month by month, for as many years as the data covers. I’m looking for patterns: Is there seasonality? Is growth accelerating or decelerating? Are there spikes that need explanation?
Then I look at the forecast and ask: Does this projection acknowledge what the actuals just told me?
The most common failure I found: no seasonality. A Phoenix shade installation company with a clear summer peak and winter trough was projecting smooth 7.5% monthly growth through 2028 — every month identical, no seasonal pattern whatsoever. A mobile entertainment franchise with obvious summer peaks and winter valleys was using the same flat growth rate. A roofing contractor in Las Vegas with three months of data was projecting flat revenue forever.
Seasonality is the single most missed pattern in financial forecasting. If your business has a busy season and a slow season — and almost every business does — and your forecast doesn’t reflect it, the forecast is lying to you every month. It overpromises in slow months and underpromises in peak months, which means your cash planning is wrong in both directions.
5. Do the Costs Survive the Forecast?
The second most common failure — and arguably the more dangerous one — is costs vanishing in the projection.
I reviewed a collectibles e-commerce business doing $3.2 million in revenue with 4.4% gross margins (extremely thin — almost all revenue goes to inventory). In the forecast, COGS dropped to zero. The model showed 100% gross margins on $5.7 million in projected revenue. That’s not a forecast. That’s a fantasy.
A roofing contractor projected 100% gross margins starting in April — no materials, no subcontractors. A consulting business showed $91,000/month in revenue with $0 in expenses. An online education company carried revenue forward at $36,000/month while every expense line zeroed out.
This happens because the forecast formulas don’t extend past the actuals boundary. Revenue has a growth assumption; costs don’t. So revenue marches upward while costs fall off a cliff. The result is a model that shows spectacular profitability — on paper — while the actual business burns cash.
If you’re a CEO looking at your own forecast and the margins look too good past a certain month, check whether your costs are actually projecting forward. They probably aren’t.
6. Do the Customer Numbers Add Up?
The IFM includes a customer roll forward — a model of how customers move through the business: new acquisition, repeat purchase, churn. It’s driven by marketing spend, acquisition cost, average order value, and retention rate.
The customer roll forward should produce a revenue number that matches the income statement. In several portfolio companies, it didn’t. One showed $818,000 in projected revenue from the customer model and $534,000 on the income statement — for the same months. Two parallel views of the same business, disagreeing by 53%.
When the customer model and the income statement don’t agree, the CEO has no single source of truth. The customer model says one thing about growth; the P&L says another. Which one do you plan against?
7. Can the Business Pay Its Bills?
Finally, I look at the balance sheet. Does cash go negative in any forecast month? Is accounts receivable growing faster than revenue (meaning collections are slowing)? Is accounts payable building up (meaning the business is stretching payments)?
One fitness e-commerce company had $8,000 in cash, $393,000 in aged payables (with $216,000 over 90 days past due — including two law firms), and a forecast projecting exponential growth with zero salary expense and $23 million in revenue. The numbers on the income statement looked fine. The balance sheet told the real story.
A workers’ comp law firm had $0 in the forecast because only one revenue line had a projection formula — the other six revenue categories simply disappeared after the actuals boundary. An investor-funded startup was burning $75,000/month with zero revenue and deeply negative equity, entirely dependent on intercompany transfers from a related entity.
The balance sheet is where optimism meets arithmetic. And arithmetic always wins.
Why This Matters to CEOs
If you’re running a business and someone hands you a financial model, you need to know: Can I trust this?
Not “do the numbers look good” — because anyone can make numbers look good by projecting growth and forgetting to project costs. The question is whether the model’s assumptions are honest, whether the data underneath is clean, and whether the forecast acknowledges what the actuals already told you.
An IFM, properly built and maintained, gives you that. It instruments the engine that produces your revenue — not just the revenue itself. It shows you unit economics: what it costs to acquire a customer, what they’re worth over time, whether your contribution margin is improving or eroding. It catches data quality problems before they compound into bad decisions.
And it runs weekly. Fifty-two feedback loops a year instead of twelve. Feedback loops make systems stable. That’s not philosophy — that’s control theory.
Why This Matters to Aspiring CFOs
If you want to be a CFO — not a controller, not a bookkeeper, but a strategic financial leader — you need to understand something the accounting curriculum doesn’t teach:
The books are not the business.
The books are a record of what happened. The business is a living system that acquires customers, delivers value, collects cash, and reinvests. A great CFO understands both — and knows how to build the bridge between them.
That bridge is the IFM. It takes the bookkeeping data (which must be clean — that’s non-negotiable) and layers on the operational model: customer dynamics, unit economics, forecast assumptions, scenario analysis. It turns backward-looking compliance into forward-looking visibility.
Every failure pattern I found in these 30 models is a CFO-level failure:
- Missing seasonality means the CFO didn’t study the business’s actual revenue patterns before building the forecast.
- Vanishing costs means the CFO (or whoever built the model) didn’t verify that every cost category projects forward past the actuals boundary.
- Disconnected customer models means the top-of-funnel growth story doesn’t tie to the bottom-line revenue — a credibility problem in any board meeting or lender conversation.
- Stale bookkeeping means the data foundation is unreliable — and no amount of sophisticated modeling fixes bad inputs.
The aspiring CFO who can walk into a business, connect the books, build an IFM, and produce a forecast that honestly reflects how the business actually works — that person is rare. And that person is worth a lot.
What Quality Looks Like
I’ve now read millions of cells across 30 financial models. The best ones share three qualities:
Clean data. All accounts reconciled. No stale items. Error Checker passing. The foundation is solid.
Honest assumptions. The forecast reflects the business — including its seasonality, its cost structure, and its limitations. When growth is assumed, there’s a reason (increased marketing spend, new channel, pricing change). When margins improve, there’s a mechanism.
A single source of truth. The customer roll forward, the income statement, and the balance sheet all tell the same story. There’s one model, and it’s internally consistent.
That’s Quality. Not in the abstract Pirsig sense — although he’d recognize it. Quality in the concrete, operational sense: a model that produces clarity. A model a CEO can look at and see their business as it actually is.
Most financial models don’t have it. That’s the gap this work is trying to close.
Phaedrus Quality Bookkeeping reviews IFMs and assesses bookkeeping quality for Weekly Accounting clients. To see what your books look like through the IFM lens, connect your QuickBooks.